
By Brett Munster
On October 6, 2025, bitcoin reached a record high above $126,000, driven by accelerating institutional adoption, persistent ETF inflows, and rising macroeconomic uncertainty. Yet only four days later, on October 10, the market experienced one of the largest liquidation cascades in crypto’s history. As discussed in the prior issue of our Node Ahead newsletter, more than $19 billion in leveraged positions were erased across derivatives markets in less than 24 hours. The forced unwinding triggered a sharp breakdown in price and materially altered the market’s structure.
Since that event, bitcoin has retreated from its October peak and, as of this writing, trades near $110,000. Sentiment has shifted from growing exuberance to far more fragile resilience. What appeared less than a month ago to be a straightforward extension of the bull market now looks increasingly uncertain. In our assessment, the market has arrived at a decisive inflection point, with $95,000 representing far more than a psychological threshold. It is the dividing line between consolidation within a broader uptrend and a transition back into bear market dynamics.
To understand why this level carries such weight, it is necessary to examine both technical structure and on-chain economic reality in the context of the recent sell-off.
As we noted in our August 26 issue of The Node Ahead, bitcoin had traded within a well-defined upward channel since the launch of spot Bitcoin ETFs in early 2024. The October 10 liquidation event did more than eliminate excess leverage; it forced price below the lower boundary of that long-standing channel. Historically, sustained departures from established price envelopes signal regime shifts. Markets either mean revert violently back into the prior range or accelerate into structurally weaker territory marked by persistent sell-side momentum.
The central question is therefore straightforward: will bitcoin re-enter its former range and resume its progression toward higher highs, or has cyclical momentum already deteriorated into the early stages of a new bear market?
From a technical perspective, several key supports have already failed. Bitcoin, Ethereum, and Solana have each lost important moving averages on both daily and weekly timeframes, signaling erosion in trend strength across major cryptoassets. For bitcoin specifically, the 50-week simple moving average sits near $100,000. In prior cycles, repeated weekly closes below the 50-week average have coincided with the conclusion of sustained uptrends and the beginning of prolonged bearish phases.
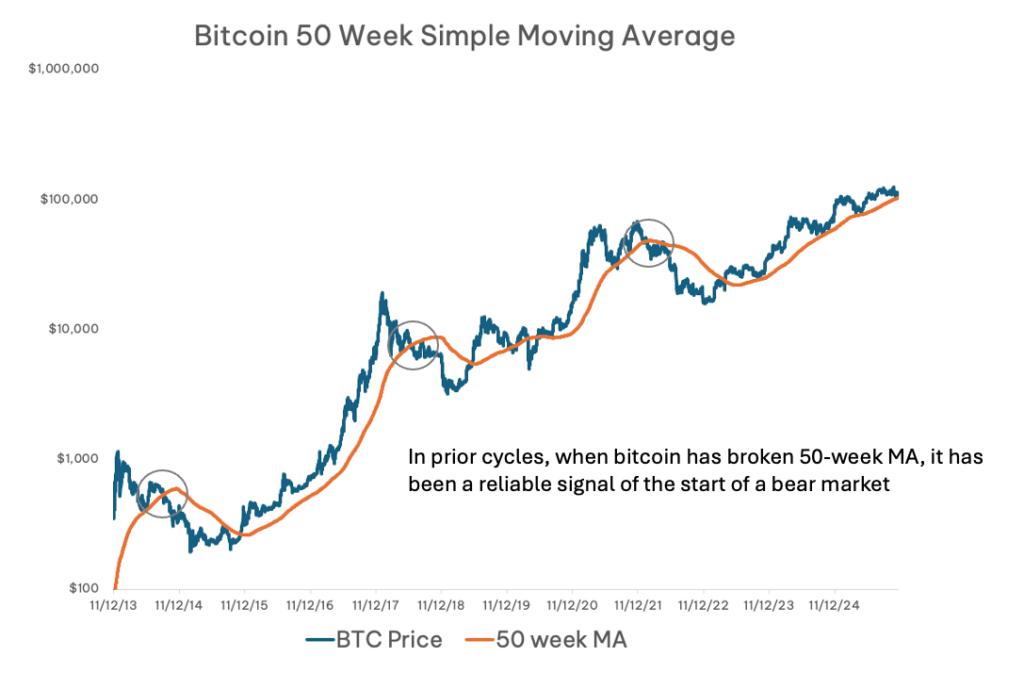
The $100,000 level also carries substantial psychological and structural importance. Earlier in the year it functioned as a formidable ceiling before being decisively reclaimed during the 2025 advance. A sustained break below that level undermines the narrative that the bull market remains intact, particularly against a backdrop of broader macro-driven risk aversion.
Even more consequential, however, is the region around $95,000, where technical structure converges with on-chain economics in a way that amplifies its significance.
To assess the market’s internal fragility, it is essential to evaluate metrics that reflect actual investor cost bases and capital commitment. One such framework is True Market Mean, introduced by David Puell and James Check in their paper Cointime Economics. This metric refines the concept of realized price by isolating the cost basis of actively circulating supply and excluding long-dormant or likely lost coins that do not meaningfully participate in price discovery. The result is a more economically relevant estimate of where engaged capital is positioned.
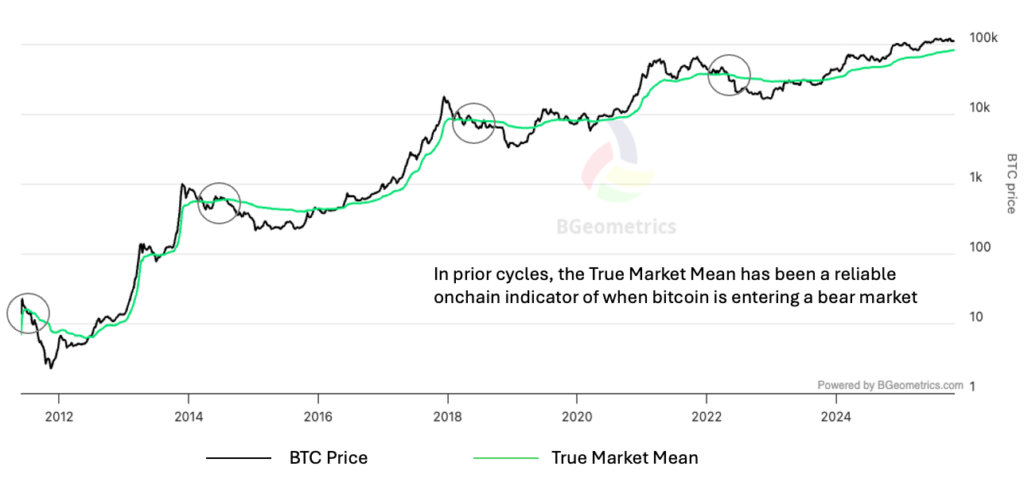
In the current cycle, the True Market Mean clusters near $95,000. This implies that the average cost basis of actively traded bitcoin sits at approximately that level. A decisive move below it would place the majority of economically relevant participants into unrealized loss territory, a condition that tends to alter behavior in measurable ways.
At the $95,000 zone, roughly 65% of active invested capital would be underwater. Nearly all short-term holder positions would reflect unrealized losses, and approximately one-third of long-term holder capital would also fall below cost basis. When such a large share of participants moves into negative territory, latent supply can convert into realized selling pressure as investors seek to limit drawdowns or reduce exposure. Conversely, when price remains above aggregate cost basis, unrealized losses are contained and confidence is more readily sustained.
The clustering of investor cost bases around $95,000, combined with the deterioration in technical structure, makes this region a clear line of demarcation. A break below it would more credibly signal a transition from corrective pullback to broader bear regime.
If that floor fails decisively, both historical precedent and on-chain metrics suggest that substantially lower targets would come into focus. Three benchmarks, notably, converge within a similar range.
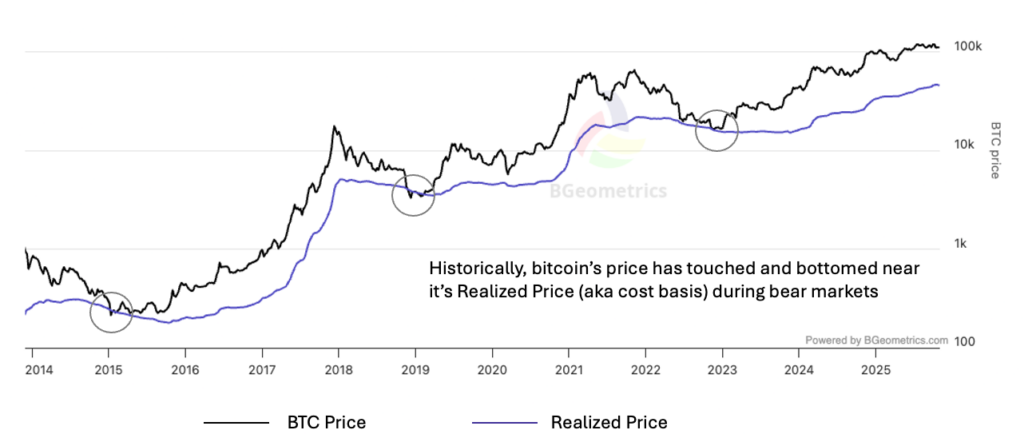
First, bitcoin’s Realized Price, which reflects the average cost basis of the entire circulating supply, currently sits near $56,000. In previous cycles, bear market troughs have gravitated toward this metric, as it represents the aggregate capital commitment across all coins and often functions as a long-term gravitational center during prolonged downturns.
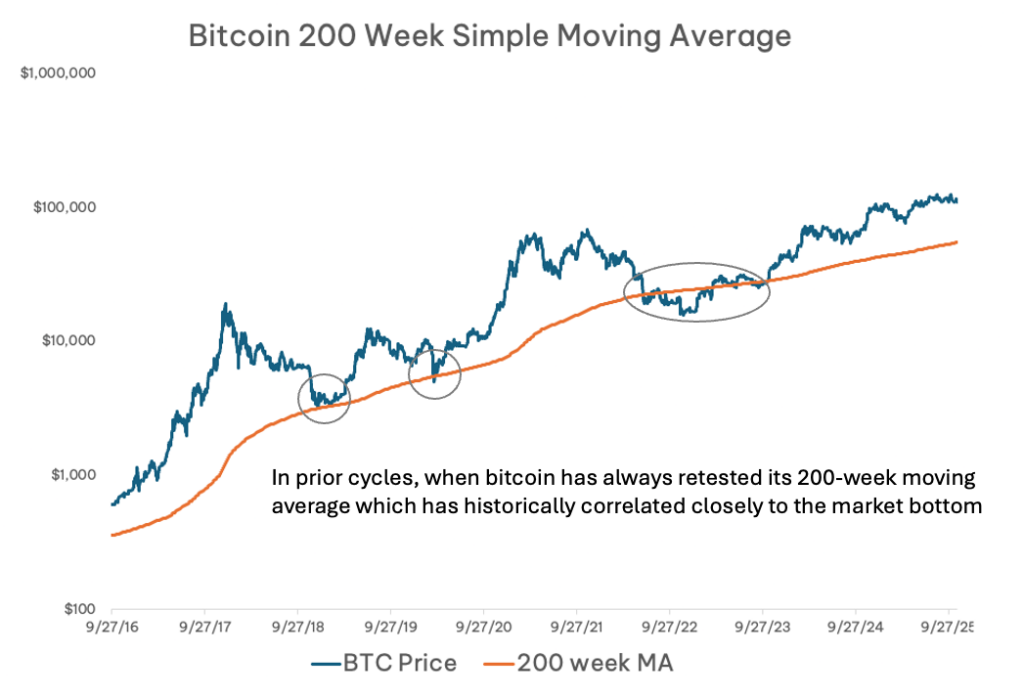
Second, the 200-week moving average—widely regarded as a structural trend anchor—resides near $58,000. Across prior cycle bottoms, price spent extended periods consolidating around this long-term average before establishing durable recoveries.
Third, historical drawdowns provide additional context. Bitcoin declined approximately 94% in 2011, 86% in 2014, 80% in 2018, and 72% in 2022. Each successive cycle has exhibited a diminishing magnitude of peak-to-trough decline, a pattern consistent with increasing market depth, liquidity, and institutional participation. If that progression continues, a 55% to 65% percent drawdown from the recent $126,000 high would be plausible. Such a move would imply a cyclical bottom between roughly $44,000 and $56,000.
The convergence of Realized Price, the 200-week moving average, and a historically typical drawdown magnitudes suggests a potential bear market trough in the $45,000–$60,000 range. A sustained break below $95,000 would likely signal more than a shallow correction, instead indicating a transition into full bear market conditions, with prices potentially drifting toward this lower band over subsequent months.
The market now faces two coherent, though divergent, paths. In the first, price stabilizes at or above $100,000 and reclaims the 50-week moving average. Under this outcome, the October liquidation cascade would be interpreted as a necessary purge of excess leverage rather than the end of the cycle. With forced selling absorbed and positioning reset, the market could enter a consolidation phase before attempting to challenge new highs.
In the second scenario, bitcoin fails to hold the $95,000 threshold and breaks lower with conviction. Such a move would push a majority of active participants into loss, intensify selling pressure, and reinforce negative technical momentum. In that environment, realized price and the 200-week average would become the most probable structural floor, but only after a sustained period of downside repricing.
The October 10 liquidation event did not simply reduce price; it altered the psychological and structural foundation of the market. The durability of the bull case now hinges on whether support near $95,000 can withstand renewed pressure. This level encapsulates the collective cost basis of active capital, key technical trend markers, and historically reliable signals of regime change. If bitcoin holds above it, the path toward renewed upside remains viable. If it breaks decisively below, the evidence would increasingly favor the conclusion that a new bearish phase of the cycle is already underway.
Disclaimer: This is not investment advice. The content is for informational purposes only, you should not construe any such information or other material as legal, tax, investment, financial, or other advice. Nothing contained constitutes a solicitation, recommendation, endorsement, or offer to buy or sell any securities or other financial instruments in this or in any other jurisdiction in which such solicitation or offer would be unlawful under the securities laws of such jurisdiction. All Content is information of a general nature and does not address the circumstances of any particular individual or entity. Opinions expressed are solely my own and do not express the views or opinions of Blockforce Capital or Onramp Invest.
BACK TO INSIGHTS