
By Brett Munster
The Bitcoin Multiplier Effect
One thing most people have yet to grasp about bitcoin is that an inflow of $1 million of capital does not mean the market cap of bitcoin increases by $1 million. In practice, the market cap rises significantly more than the amount of net inflow of capital which results in the price of bitcoin accelerating upwards as net inflows increase. This is what is known as the bitcoin multiplier effect and explains in part why bitcoin’s price goes on such parabolic growth spurts every few years.
Take the ETFs for example. One month after the ETFs launched, the total net inflow into all the bitcoin ETFs was just over $5 billion dollars. However, during that same time span, bitcoin’s market cap rose roughly $90 billion dollars to around $1 trillion. Now in all fairness, over that month the ETFs weren’t the only buyers and sellers of bitcoin. Although the ETFs have dominated volumes, there is still plenty of buying and selling on crypto exchanges throughout the world. So, the question becomes, can we measure how much the market cap moves for every net new dollar that is deployed into the bitcoin ecosystem. The answer is yes, yes we can.
In past issues we have highlighted an on-chain metric called MVRV that has historically been a great indicator of market tops and bottoms. MVRV is a ratio comparing Market Value (MV) to Realized Value (RV). Market Value is simply another name for market cap while Realized Value calculates the value of the network using the price at which each individual coin (or fraction of a coin) was last moved. Realized Value is thus a gross approximation of the network’s aggregate cost basis.
Rather than using this metric to identify market cycles, we can use the components of Market Value and Realized Value to calculate the bitcoin multiplier effect. By comparing the ratio of the percent change in both the Market Cap and the Realized Cap we can measure the required net capital inflow/outflow to the Realized Cap required to enact a 1% change in Market Value. And if we know how much the market cap moves and we know how many BTC there are, we can determine how much price is likely to move for every dollar that is invested into bitcoin.
The blue line in the graph below is bitcoin’s Realized Value and the grey shading shows how much investment is required to move bitcoin’s market cap by $1 at any given point over the last 9 years. The redline shows the 4-year average of the grey shaded area. Today that 4-year average is 0.24 meaning it takes $0.24 of net new investment to increase the market cap of bitcoin by 1 dollar. Said differently, the market cap rises on average by roughly $4 for every $1 of net inflow of capital. That’s a 4x multiplier.
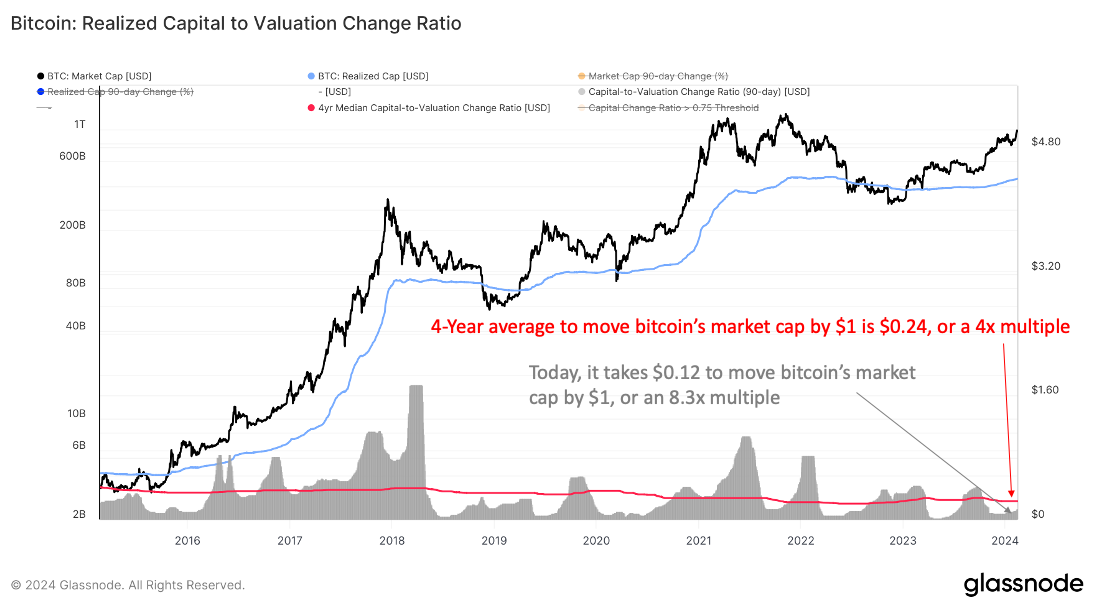
It’s also worth noting that the red line is sloped downwards which means over time, on average, it is taking less and less capital to increase the market cap (and thus the price) of bitcoin. In February of 2015, it took on average $0.41 to move the market cap $1. That’s a 2.4x multiple. Today that 4-year average has grown to 4x meaning the market cap of bitcoin is increasing significantly more for every dollar of investment than it did 9 years ago.
So, we know that the average multiplier over the last 4 years is 4x. That gives us a good historical baseline, but it doesn’t tell us what the multiple is today. Looking at the shaded grey area, the data tells us that it currently only takes $0.12 to move the market cap $1. That’s a multiple of 8.3x. Today, for every dollar that is currently invested, the market cap rises by $8.30.
Why is the multiplier historically high right now? I’d argue its due to the growing supply shock bitcoin has been experiencing over the last couple of years. We have discussed at length in past newsletters how there is less and less available supply because there is an increasing tendency for investors to hold onto their bitcoin long term. Less supply means greater movement in price when there is an increase in demand.
That’s why bitcoin’s market cap has risen by $90 billion since the ETFs launched even though there was significantly less than that actually invested into bitcoin. Based on the multiplier, we can infer that there has been about an $10.5 billion net inflow of capital over that time meaning the $5 billion from the ETFs made up just under half the capital inflow.
Given the current pace at which capital is flowing into the bitcoin ETFs, it’s not unreasonable to think we may see $25-$50 billion by the end of the year from the ETFs alone. Using today’s multiplier of 8.3x, that’s an increase of $200 billion – $415 billion in bitcoin’s market cap. There are roughly 19.6 million BTC outstanding which means bitcoin’s price could rise to $60k – $75k on the back of the ETFs alone by the end of the year. That price doesn’t take into account any net inflows from Coinbase, Binance, Hedge Funds, or anyone else buying bitcoin not through an ETF. If the ETFs remain roughly half of the volume as it is currently, that would suggest a possible $80k-$100k bitcoin price by the end of the year.
Price predictions in the hundreds of thousands per BTC in the next couple of years may seem ludicrous at first glance but when you understand the supply and demand dynamics at play, it’s really not that hard to see how bitcoin’s price has the potential to skyrocket to those levels. I’m not saying it is guaranteed to happen, I’m just saying the conditions are in place for those types of price appreciation to possibly come to fruition.
The Halving is less than 2 months away
By the time this newsletter is published, the Halving will be less than two months away. Just in case you aren’t familiar with what the Halving is, here is a quick, high-level recap.
A block is a collection of transactions on the Bitcoin network. Blocks are created by miners in chronological order thereby creating a chain of blocks which is why we call it a “blockchain.” In exchange for creating and validating these blocks of transactions, miners are rewarded with block subsidies and transaction fees which provide an economic incentive to the miners to secure and operate the network. A block subsidy is just a fancy term for the issuance of newly minted bitcoin.
Roughly every 10 minutes, a miner creates a new block of transactions, adds it to the existing chain of blocks, and is rewarded with bitcoin. The amount of bitcoin the miner is rewarded with is pre-determined by Bitcoin’s code. When the Bitcoin network first launched, it rewarded miners with 50 BTC for every block. However, written in the network’s code is a feature that every 210,000 blocks (which equates to every 4 years) the block subsidy is cut in half. This reduction in the block subsidy is what is known as “The Halving.”
On November 28, 2012, Bitcoin experienced its first Halving event in which the block subsidy was reduced from 50 BTC per block to 25 BTC per block. The second Halving occurred on July 9, 2016, which reduced the block subsidy to 12.5 BTC per block. The third Halving occurred on May 11, 2020, which further reduced the block subsidy to 6.25 BTC per block which is where we currently stand today.
The next Halving is currently on track to occur on April 20th and will reduce the block subsidy to 3.125 BTC per block. We will go from issuing 900 new bitcoin per day to 450 new bitcoin per day.
The Halving is an important milestone for two reasons. First, it puts into stark contrast the monetary policy of bitcoin compared to the monetary policy of every fiat currency. On one hand, bitcoin’s supply issuance is consistent, predictable, and cannot be changed by any single person, corporation, or government. This makes bitcoin’s monetary policy immune from political whims. In contrast, the dollar’s monetary policy is determined by a small group of unelected officials operating behind closed doors. The current financial system is so opaque that the entire financial world waits for periodic announcements and then attempts to read the tea leaves in order to guess at what will happen to interest rates and liquidity. There is little predictability over the next six months let alone the next several years. In comparison, there is no guessing required with bitcoin’s supply.
Furthermore, bitcoin’s supply is not only capped, but its supply issuance (and thus inflation rate) decreases over time. Again, this is in stark contrast to the seemingly unlimited supply of dollars the US government can print at any time. The amount of currency debasement is not just growing over time, but accelerating which explains, at least in part, why inflation has been trending upwards over the last several years.
There is only one asset globally that has not changed its monetary policy in the last couple of years, let alone for the last fifteen. Only one with a monetary policy that is independent, predictable, and reliable. Simply put, bitcoin has the exact opposite monetary policy to the US dollar and every other fiat currency.
Second, assuming demand for bitcoin stays the same, the reduction of new supply from the Halving puts upward pressure on the price of bitcoin. Following the previous three Halvings, bitcoin’s price peaked at 9,206%, 2,882%, and 782% gains. Over time, because the total reduction of supply diminishes with each Halving, its impact on its price has lessened as well. That being said, bitcoin’s price rose 782% after the last Halving so it’s entirely possible that bitcoin’s price could increase 2-5x from today’s price and that trend would still remain intact.
What makes this upcoming Halving event unique compared to previous Halvings isn’t the supply side, it’s the demand for bitcoin. Since the launch of the bitcoin ETF in January, the buying from the combined bitcoin ETFs is outpacing every other ETF on the market, including the largest ETFs such as SPY and QQQ.
In less than two months since their launch, the 10 ETFs not named GBTC saw a total inflow of more than $12 billion. Over that same time span, GBTC saw a total outflow of about $7 billion for reasons we covered in past newsletters which resulted in a net total inflow of just over $5 billion.
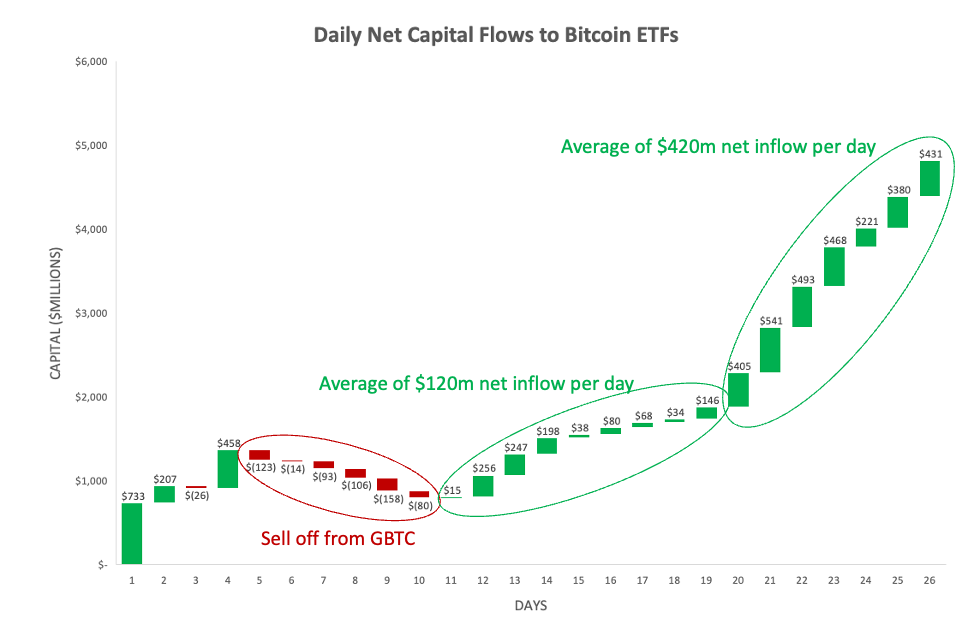
Even more interesting is that the net inflow of capital appears to be accelerating. There was an initial sell off in GBTC in the first few weeks of it being converted to an ETF but as that began to subside, we began to start seeing modest positive inflows of about $120m per day at the end of January and beginning of February. By the back half of February, the ETFs were then averaging nearly half a billion dollars of net inflow per day. To put that into context, the bitcoin ETFs are currently buying 10x more bitcoin than are being minted daily. If these inflows hold through the Halving, then Bitcoin ETFs could be buying 20x or more the amount of new bitcoin issued on a daily basis.
Based on capital flows, demand for BTC is accelerating at the same time the issuance of new supply is about to be decreased. Bottom line: supply is shrinking and demand is growing.
In Other News
Bitcoin breaks $50K for the first time since hitting all-time highs in 2021.
Ethereum hits $3k for first time in nearly two years.
Coinbase crushed wall street expectations in its latest earnings report.
Crypto money laundering dropped 30% last year.
U.S. Treasury debunks the narrative that Hamas relied on crypto to fund terrorism.
U.S. Federal Reserve Gov. Waller says DeFi could boost dollar’s global strength.
Kraken seeks to dismiss SEC lawsuit because it appears it was filed as retaliation for political remark.
$30 billion RIA platform greenlights four bitcoin ETFs.
Disclaimer: This is not investment advice. The content is for informational purposes only, you should not construe any such information or other material as legal, tax, investment, financial, or other advice. Nothing contained constitutes a solicitation, recommendation, endorsement, or offer to buy or sell any securities or other financial instruments in this or in any other jurisdiction in which such solicitation or offer would be unlawful under the securities laws of such jurisdiction. All Content is information of a general nature and does not address the circumstances of any particular individual or entity. Opinions expressed are solely my own and do not express the views or opinions of Blockforce Capital or Onramp Invest.
Disclaimer: This is not investment advice. The content is for informational purposes only, you should not construe any such information or other material as legal, tax, investment, financial, or other advice. Nothing contained constitutes a solicitation, recommendation, endorsement, or offer to buy or sell any securities or other financial instruments in this or in any other jurisdiction in which such solicitation or offer would be unlawful under the securities laws of such jurisdiction. All Content is information of a general nature and does not address the circumstances of any particular individual or entity. Opinions expressed are solely my own and do not express the views or opinions of Blockforce Capital or Onramp Invest.
BACK TO INSIGHTS