
Baron Rothschild, an 18th century British nobleman and member of the Rothschild banking family is credited with saying that “the time to buy is when there’s blood in the streets.” Rothschild made a fortune buying up assets during the panic that followed the Battle of Waterloo. Today, the fundamentals of bitcoin and many of the blue-chip assets in the crypto industry are stronger now than any time in history and yet, there is widespread panic in the market due to macroeconomic conditions and recent insolvencies from centralized lenders. For this reason, we believe it’s the right time to take a page out of Baron Rothschild’s playbook.
Price may be down but fundamentals are up
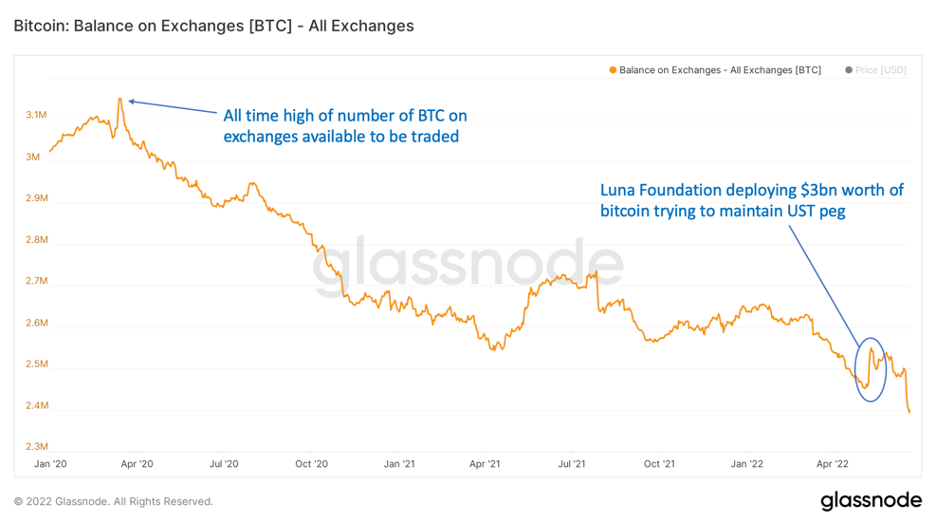
Let’s start with bitcoin’s supply. Ever since March 2020 there has been a steady trend of bitcoin coming off exchanges and transferred to cold storage. Typically, in a bear market where there is uncertainty, we would see coins being taken out of cold storage and deposited back onto exchanges indicating an intent to sell. However, this currently isn’t the case. Other than the ~80,000 coins that were dumped on the market by the Luna foundation in a failed attempt to defend the peg of UST, we have continued to see a steady flow of bitcoin out of exchanges and put away for long term accumulation.
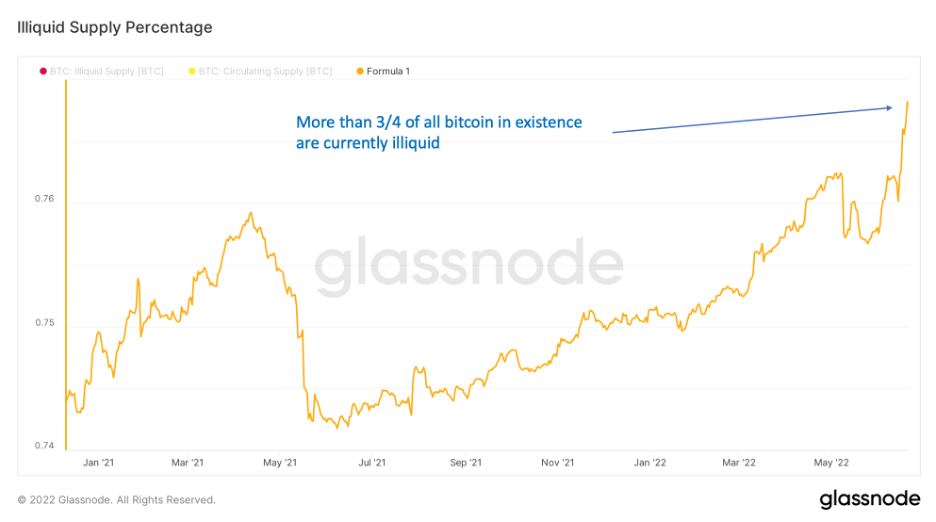
The result of this has been an increasing percentage of the total supply of bitcoin becoming illiquid. As of writing this, nearly 77% of total available supply is not available to be traded indicating there is a significant cohort of holders with long term conviction about this asset and are happily scooping up BTC at a severe discount.
Even more important for the long-term health of bitcoin than the supply squeeze that has been forming is the simple fact that bitcoin’s monetary policy remains unchanged. The total supply is still capped at 21 million. Furthermore, the network continues to issue the same amount of BTC with each new block and even as hash power on the network reaches new all-time highs (more on that below), the issuance rate remains constant just like it has for the past 13 years.
We do not have that same predictability or transparency with any other currency in the world, including the dollar. On June 15th, the Fed raised interest rates by 75 bps. I’m by no means a macro economist so I will leave it to people much smarter than me to determine what impact that will have on the economy. However, what strikes me as completely archaic is that the entire financial world waits on the edge of their seats for a small group of unelected officials to tell us what the price of money is going to be for everyone on the planet. And the decision by that small group of individuals behind closed doors has major ramifications for the entire global financial system. Everything including stocks, bonds, housing, and savings are impacted. Even worse, no one knows what the Fed will do in the future or when they might do it. Many have predictions, but no one actually knows. How strange is it that a mechanism in our financial system this important is so opaque that thousands of analysts waste countless hours analyzing and interpreting every word the Fed says (or doesn’t say) to ascertain some meaning and guessing what their next move will be?
Yet there is no guessing required with bitcoin’s supply. There is only one asset globally that has not changed its monetary policy over the last two years, let alone for the last ten. Only one with a monetary policy that is independent, predictable, and reliable. Bitcoin continues to produce block after block, uninterrupted and without a single fraudulent transaction or change in its supply issuance. In other words, nothing about the recent dip in price has altered the trust one can have in bitcoin’s system.
Nothing has changed with bitcoin’s supply dynamics since the start of the year, but what about demand? Surely if the price is falling, demand for the cryptoasset must be shrinking right? Nope.
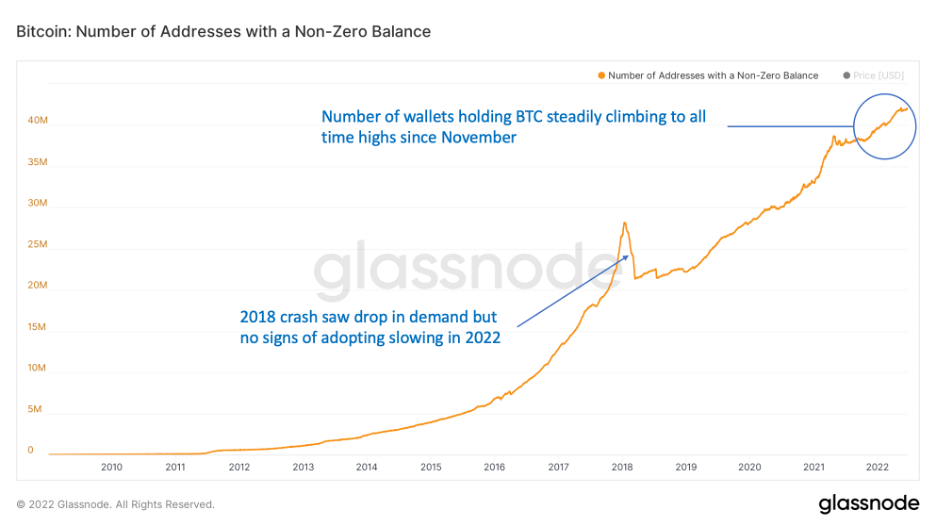
As we can see in the graph below, the number of wallets with a non-zero amount of bitcoin in them has been steadily growing since bitcoin hit its all-time high in price last November. In fact, we keep setting new all-time highs in the number of addresses holding bitcoin over the last year even as price has fallen. If we zoom out and look since bitcoin first launched, adoption very much looks like the beginning of an exponential curve. We also notice that unlike in 2018, when the demand for bitcoin did drop during that price crash, there are no signs of adoption slowing today.
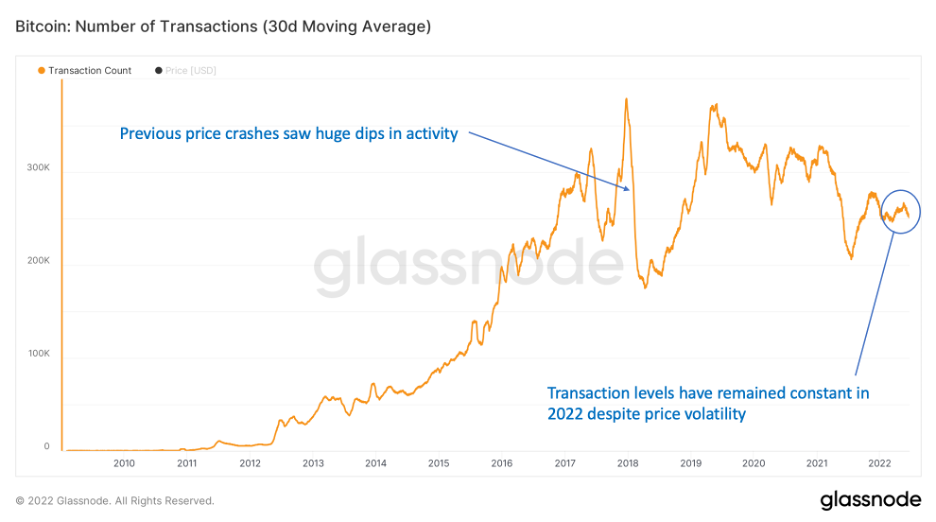
We can also look at the number of transactions processed by the bitcoin network. Unlike the last market cycle crash in 2018, transaction count has remained steady. As the graph below shows, we see active addresses and total successful transaction count remaining in line with their historical ranges.
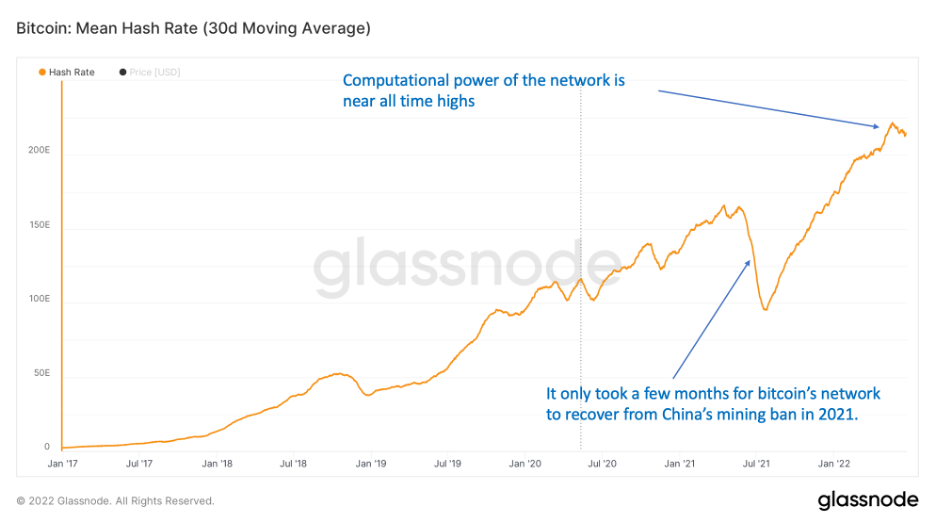
Or we can look at the hash rate on the network. Hashrate is a measure of the computational power per second used when mining. When aggregated across all miners, it’s a measure of the computing power of the Bitcoin network. Hash rate is not only a good measure of the security of bitcoin but also the health of the network. Increasing hash rate means more miners are flocking to the network to participate. As we can see in the chart below, bitcoin’s hash rate has been setting new all-time highs throughout 2022.
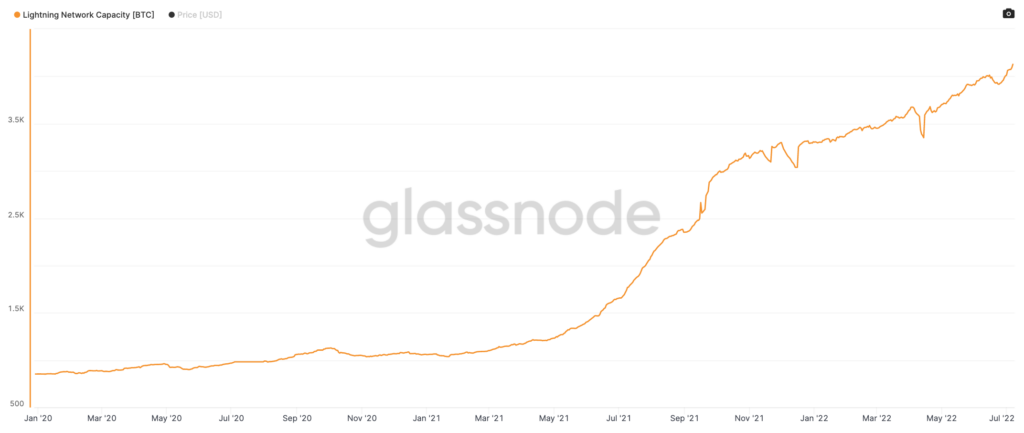
Finally, let’s look at the growth of the Lightning Network. The Lightning Network is a network of payment channels built on top of Bitcoin’s base layer blockchain that can handle thousands of transactions per second and settle them all on the Bitcoin blockchain as one transaction. Thus, the Lightning Network enables instant, secure, and nearly-free bitcoin denominated payments to anyone in the world. In the last year, the Lightning Network has grown 150% and as we can see in the chart below, the capacity of the Lightning Network is currently at all-time highs. More businesses such as CashApp and Robinhood as well as countries such as El Salvador have started to implement it. This is a strong indication of the growing utility of bitcoin as a payment system, not merely as a store of value or speculative investment.
Despite the recent price crash, bitcoin’s fundamentals are arguably stronger now than any time in its history. The supply issuance remains unchanged since its launch in 2009 with HODLers scooping up bitcoin and taking them out of the circulating supply. At the same time adoption of bitcoin continues to grow throughout the world. Hence, the underlying value of the bitcoin network continues to increase.
And yet, value and price are not the same thing, nor do they always move in tandem. Increases in interest rates, coupled with quantitative tightening, have driven sell offs across all asset classes. We saw a similar market wide selloff in March 2020 when bitcoin fell from $10,400 to $4,500. Again, that period saw a dislocation in price compared to value as fears of the pandemic began to spread but the fundamentals of bitcoin remained unchanged. 13 months later, bitcoin reached $64,000.
Or we can look back at the three other major market crashes in bitcoin’s life. In 2011, bitcoin fell 93.5%. The run up in 2013 was subsequently followed by bitcoin’s price falling 85.1% in 2014. And in 2018, bitcoin’s price fell 83.6% from its peak in 2017. And yet, after each crash bitcoin has gone on to set new all-time highs in price within a couple years after crashing. Having invested through two of those crashes, I can tell you while the outlook in the media and social media was bleak, the thing that continued to give me conviction was the growth of the underlying metrics regardless of price action. Once again, I am seeing the same pattern repeat itself.
Have we hit the bottom?
Understanding that bitcoin is currently undervalued is helpful, but that doesn’t mean the price won’t keep going lower. The next step is understanding the right time to start entering the market. In other words, is it possible to identify a bottom?
By “bottom”, I simply mean the general range that represents a trough over a longer market cycle. The following analysis is not an attempt to determine the very lowest price bitcoin will reach nor do I intend to predict the specific day at which bitcoin hits that price. It’s also impossible to predict how long a bottom may last and when price will ultimately rebound. In fact there are historical indicators that this kind of sideways price movement can last a long time such as 2015 when the “market bottom“ lasted for nearly the entire year. However, the indicators we will review show that there is historical evidence that the current price is likely at or near its bottom. Again, we need to emphasize we are using historical data to give us a degree of confidence about future long term price action but is by no means a guarantee. However, for anyone with a low time preference, we believe that this moment in time represents an incredibly attractive opportunity from a risk/reward perspective.
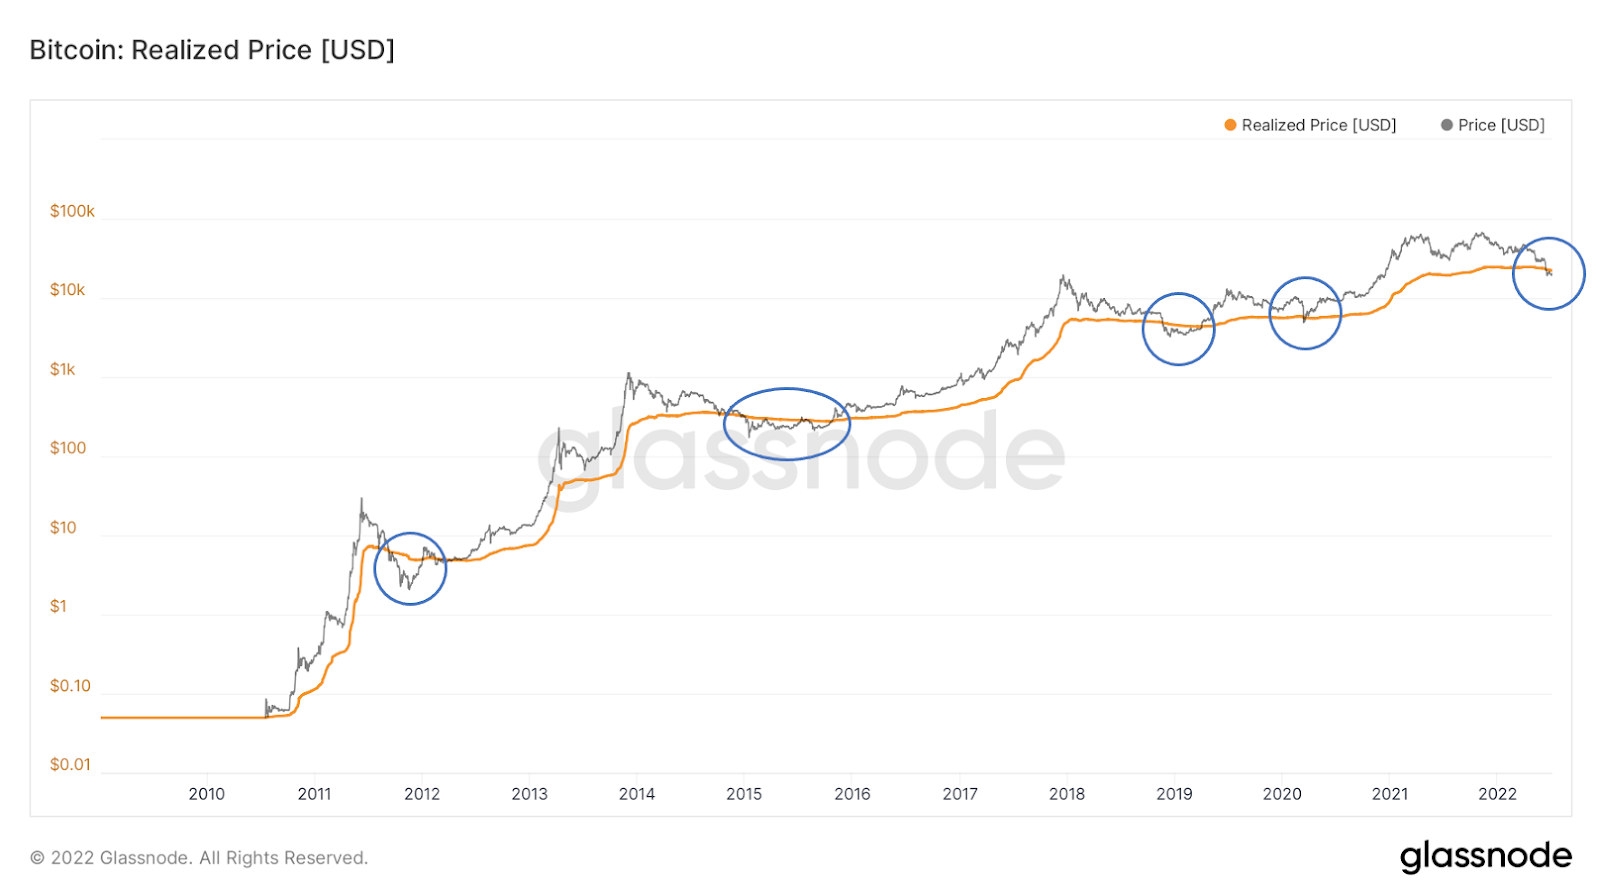
So how do we know when the bottom is? We can never know for certain but there are several historical indicators that all seem to be pointing to the same thing. For example, we can measure the realized price of bitcoin which is the price at which every bitcoin last moved divided by the current supply of bitcoin. Realized price is essentially the average cost basis per coin. Bitcoin has historically traded above its realized price for much of existence. In fact, the price has only fallen below realized price 4 previous times in bitcoin’s history. Each of those 4 times correlated precisely with the market cycle bottom. Today, bitcoin’s price sits at roughly $19,000, below its realized price of $22,000. Bitcoin has only spent about 3% of its existence below its realized price so these moments typically aren’t around for long.
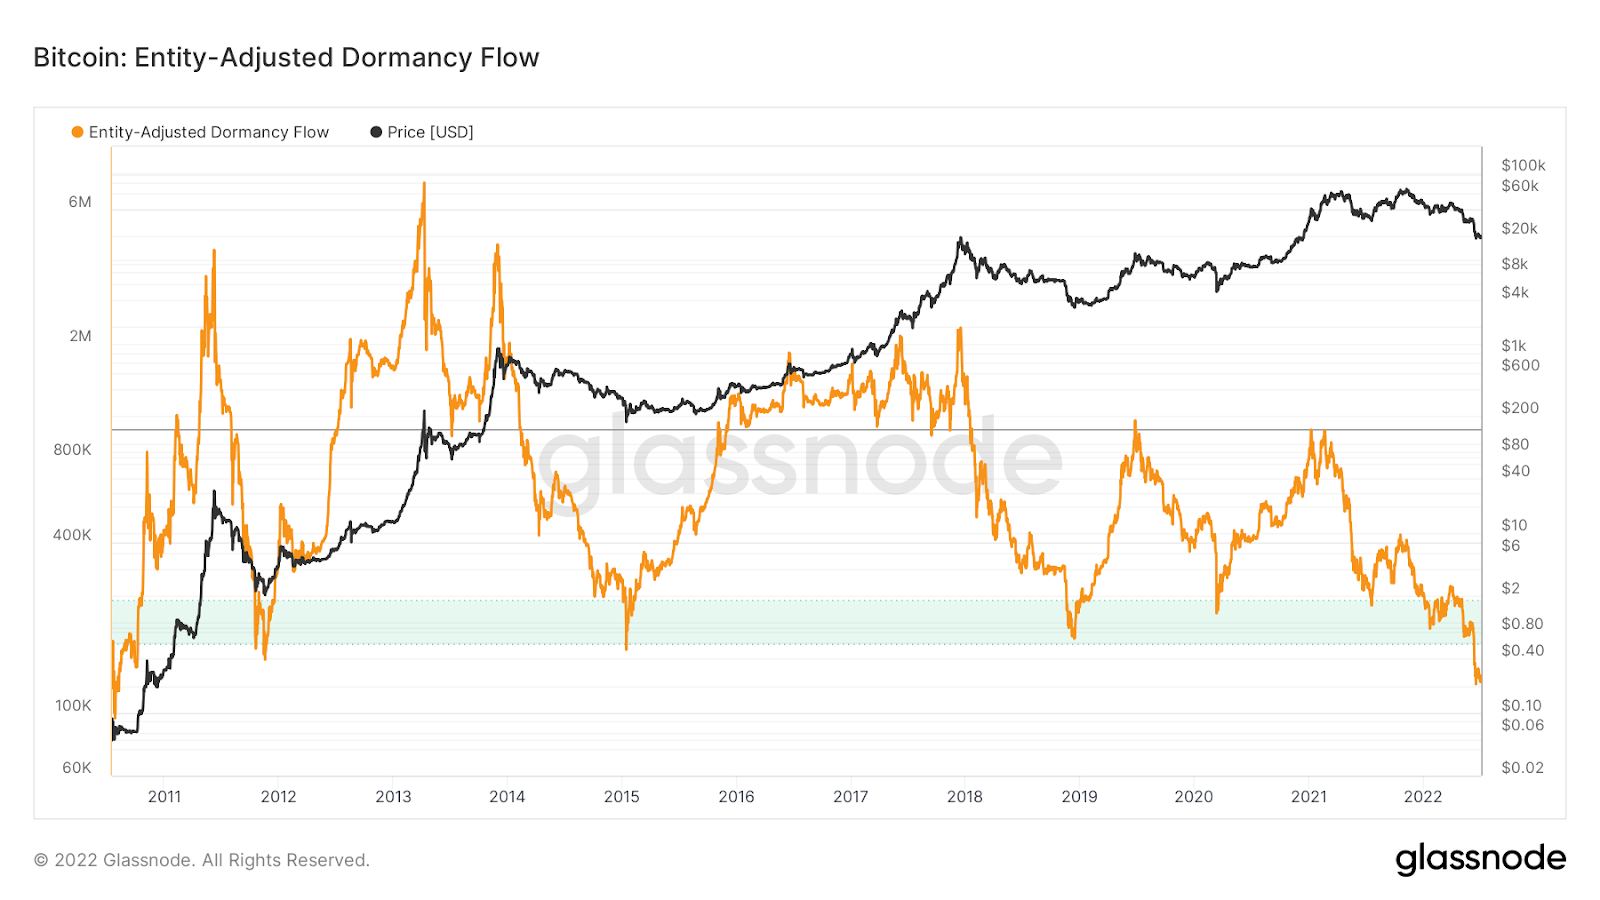
Another metric that indicates we may be near a bottom is Dormancy Flow. Originally created by David Puell, Dormancy Flow is a ratio between the market cap of bitcoin and the annualized dollar value of all coins transacted in a given year. Thus, Dormancy Flow is a good way of tracking spending behavior on the network relative to the value of the network. When Dormancy Flow values are low, that is an indication that the market cap of bitcoin is undervalued compared to spending behavior and thus represents an attractive buying opportunity for investors. Dormancy Flow bottoms have historically correlated with market bottoms and while they are infrequent, they have provided a reliable indication of when BTC is a value buy.
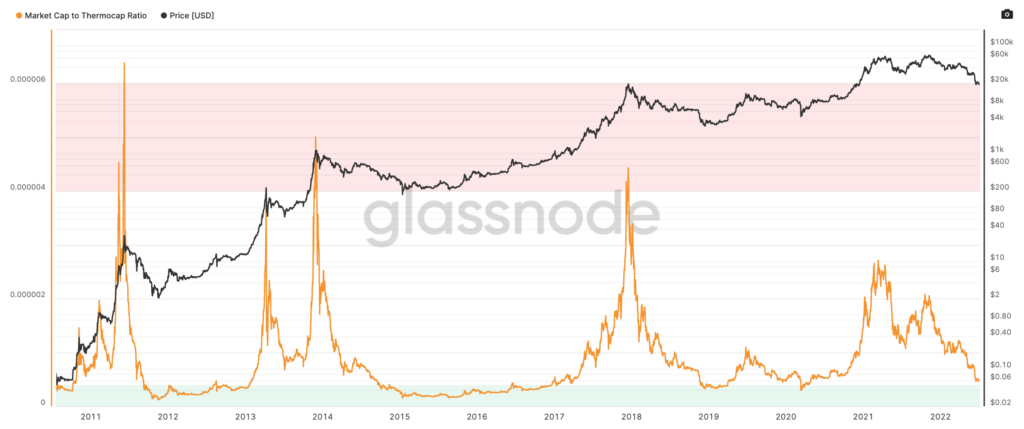
We can also look at the behavior of bitcoin miners to get a sense of where we are in the cycle. Every time a miner successfully “mines” a block, they are rewarded with a combination of newly issued bitcoin (otherwise known as a block subsidy) and a transaction fee. Together, block subsidies and transaction fees make up miners’ revenue. Aggregating the cumulative miner revenue is referred to as the “thermocap” of a network.
Miners also have a cost associated with their business, namely the mining rigs, electricity expense and rent. Therefore, thermocap can be thought of as the max amount a miner can spend to secure the network and remain in business. Because miners are responsible for the security of the network, thermocap can also be thought of as an approximation of the amount spent by the network to keep it secure and functioning properly.
First introduced by Nic Carter of Coinmetrics, we can compare bitcoin’s market cap to its thermocap to get a relative sense for how much value the network is getting for this “spend” on security and infrastructure. Because bitcoin’s supply issuance is relatively constant, thermocap does not fluctuate nearly as much as market cap. Historically, a low market cap to thermocap ratio has historically signaled a relatively good time to buy. Today, that ratio is beginning to enter a range that has correlated with market bottoms in previous cycles.
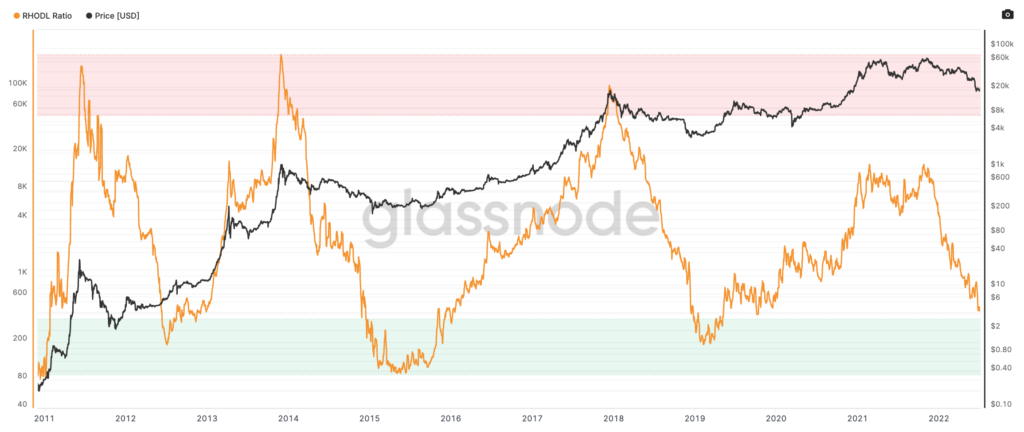
We can also look at the age distribution of coins on the network. Because bitcoin’s blockchain data is public, we can analyze precisely how often coins (or fractions of a coin) are transacted with and when any particular coin was moved last. If we group these coins by different age cohorts, we can get a detailed view into the activity of the network by participants with different time preferences. Of all the different bands, the “1-year to 2-year” cohort and the “1-week to 1-month” cohort are particularly interesting because historically, these two bands tend to move inversely of each other. At market bottoms, the “1-year to 2-year” ratio tends to be at maximum supply for that cycle while the supply of coins “1-week to 1-month” old are at a minimum. The reverse has also historically been true at market tops. Understanding this phenomenon and layering in the realized value of the coins for each cohort, we come up with the Realized HODL Ratio (RHODL).
First created by Philip Swift in 2020, the RHODL is the ratio between the realized value of the “1-week to 1-month” cohort compared to the realized value of the “1-year to 2-year”. Because older coins tend only to sell when there is a large run up in price, this metric gives us a clear view into the cyclical nature of long-term holders selling to short term market participants. As a result, RHODL tends to closely track with the macro market cycles. A high RHODL ratio (red band in the chart below) is an indication of an overheated market with lots of previously locked up supply coming onto the market and has historically corresponded with cycle tops. A low RHODL ratio (green band in the chart below) indicates the market is entering an accumulation phase and has historically coincided with cycle bottoms.
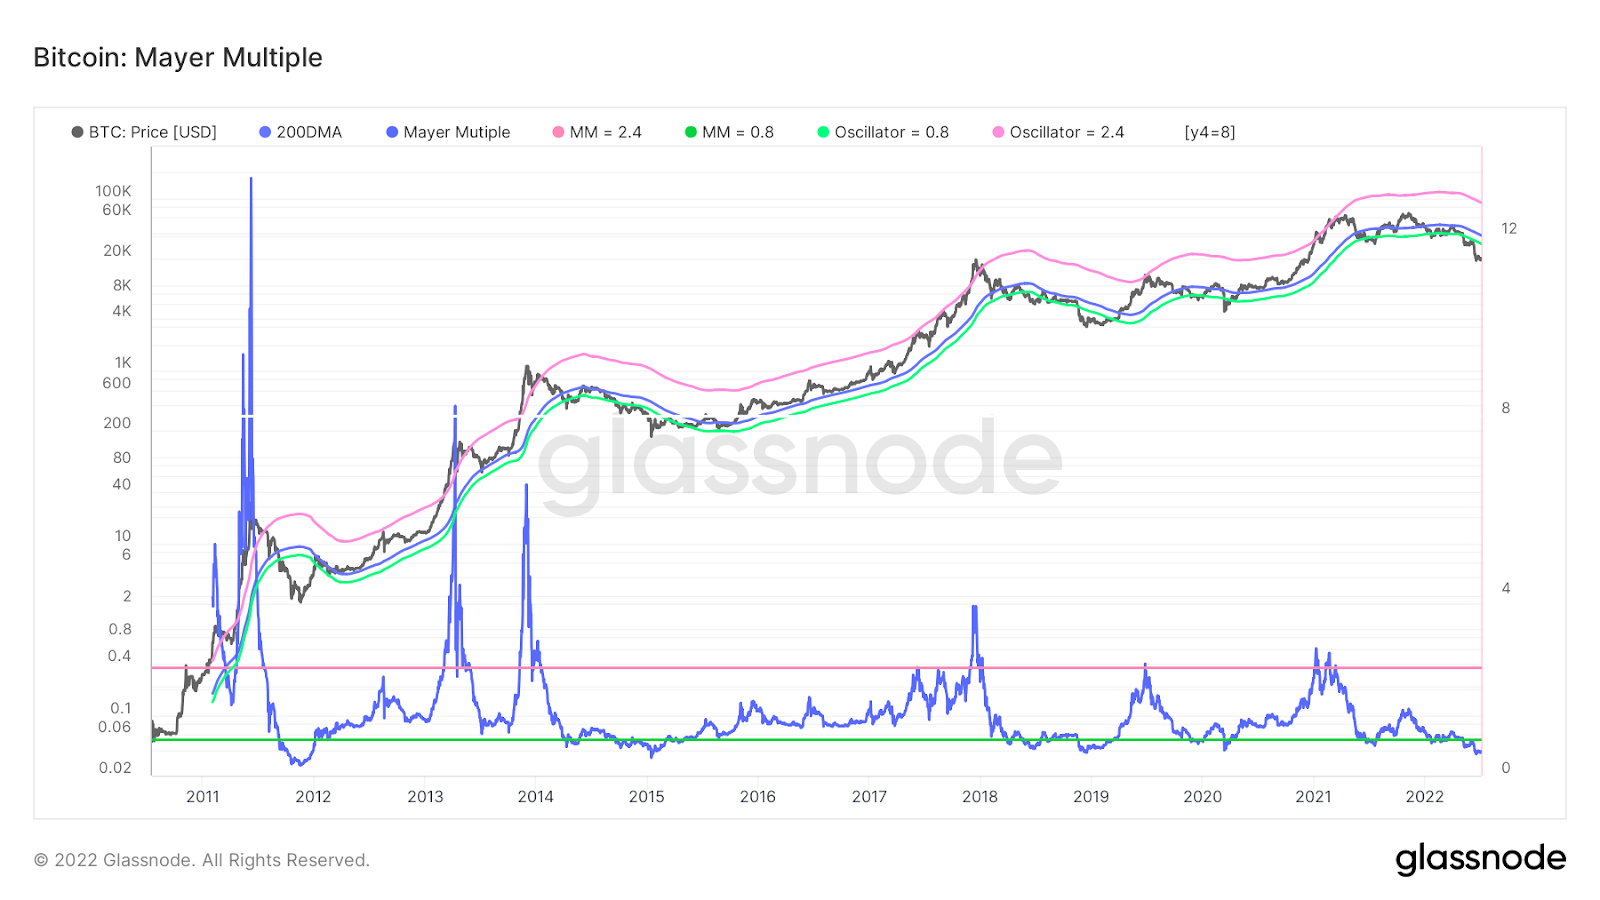
Even traditional metrics are indicating bitcoin may be near a bottom. In traditional finance, the 200-day moving average is a widely recognized indicator for determining when to buy or sell. The Mayer Multiple is a ratio between price and the 200-day moving average and therefore can be used as a tool to gauge when an asset is overbought or oversold. In bitcoin’s history, overbought periods (peaks) have coincided with a multiple of 2.4 while oversold periods (bottoms) have coincided with 0.8. As of writing this, bitcoin’s Mayer Multiple is sitting at 0.52.
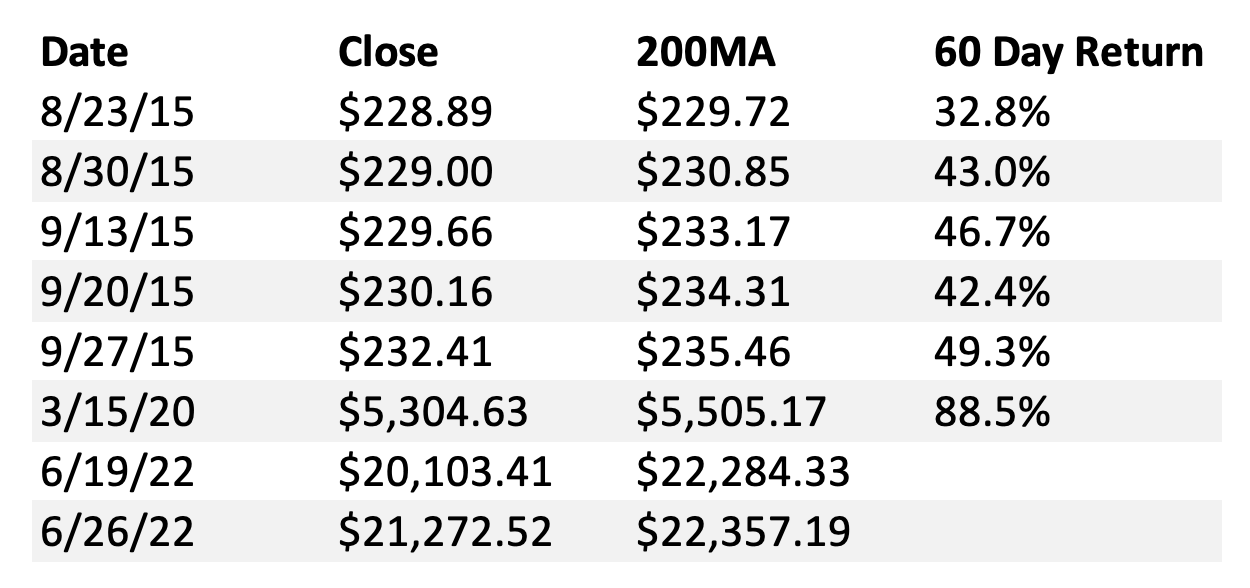
So how has bitcoin historically performed after falling below its 200 day moving average? The 60 day returns for bitcoin have historically been quite strong and the long term appreciation is even more impressive.
Conclusion
Market crashes are never fun, but the indicators of growth and adoption of the bitcoin network are telling a different story than what price alone might lead you to believe. The data shows us that the fundamentals of the network have never been stronger and the adoption of bitcoin has never been greater. Bitcoin’s supply issuance remains constant and ultimately capped at 21 million. HODLers continue to take more supply off exchanges and hold for the long-term creating one of the largest supply squeezes in bitcoin’s history. Countries are continuing to embrace bitcoin to varying degrees. Even within the US, there is enough political support for bitcoin so it is unlikely to be regulated away and any anti-crypto regulation seems to be focused on stablecoins, not bitcoin. Bitcoin has been significantly de-risked over the past year (that’s not to say there is no risk) and yet we are sitting at a price per bitcoin lower than a year ago. All the while, the long-term upside is orders of magnitude from where we currently stand today.
And yet, macro forces and confusion from market participants that don’t yet fully understand crypto have kept prices suppressed. This isn’t to say prices can’t go lower in the short term, they definitely could. It’s impossible to know for sure if we have hit the bottom or how long that bottom may last. But even if we haven’t hit the very bottom, the data suggests we are likely pretty close. What we are confident in however, is that crypto’s price has momentarily dislocated from its value and over a long enough time horizon, price and value will converge just like they have after every previous market crash. For this reason, we believe this current period of time is one of, if not the greatest risk adjusted buying opportunities in crypto’s history.
Disclaimer: This is not investment advice. The content is for informational purposes only, you should not construe any such information or other material as legal, tax, investment, financial, or other advice. Nothing contained constitutes a solicitation, recommendation, endorsement, or offer to buy or sell any securities or other financial instruments in this or in any other jurisdiction in which such solicitation or offer would be unlawful under the securities laws of such jurisdiction. All Content is information of a general nature and does not address the circumstances of any particular individual or entity. Opinions expressed are solely my own and do not express the views or opinions of Blockforce Capital.
Disclaimer: This is not investment advice. The content is for informational purposes only, you should not construe any such information or other material as legal, tax, investment, financial, or other advice. Nothing contained constitutes a solicitation, recommendation, endorsement, or offer to buy or sell any securities or other financial instruments in this or in any other jurisdiction in which such solicitation or offer would be unlawful under the securities laws of such jurisdiction. All Content is information of a general nature and does not address the circumstances of any particular individual or entity. Opinions expressed are solely my own and do not express the views or opinions of Blockforce Capital or Onramp Invest.
BACK TO INSIGHTS