
There are three pillars to bitcoin’s monetary policy. The first is the fixed supply of 21 million BTC that gives bitcoin absolute scarcity. Second is the difficulty adjustment which ensures that a predetermined amount of bitcoin is released, on average, every 10 minutes regardless of how much computational power (aka Hash Rate) comes onto or off the network. This makes bitcoin’s supply issuance completely transparent, predictable, and inelastic (an increase of miners does not increase the output of more blocks). The third pillar is the predetermined amount of new bitcoin released with each block mined.
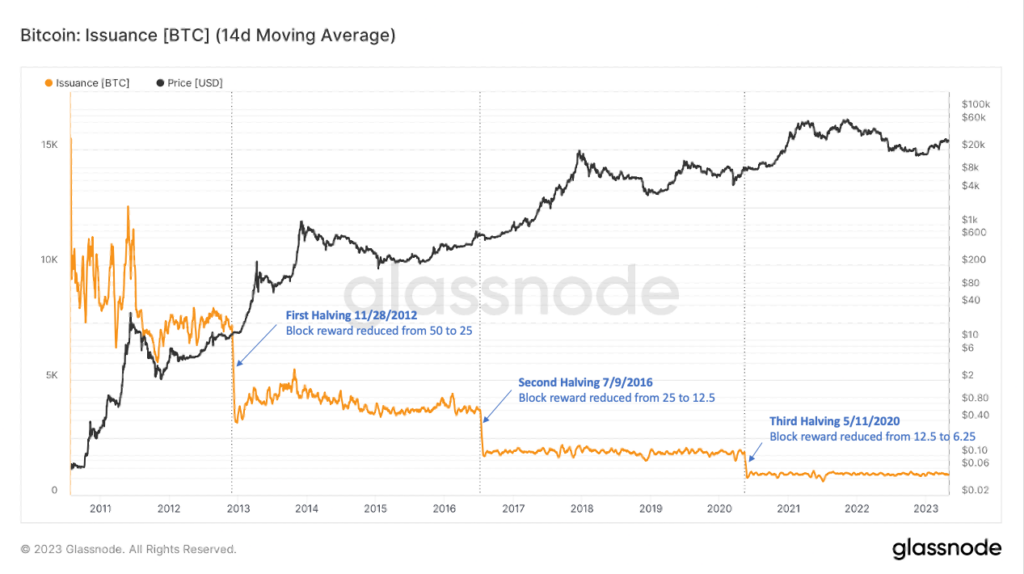
When bitcoin was first launched in January 2009, 50 new bitcoin were released with each subsequent block that was mined. However, Satoshi wrote into the code of the bitcoin protocol that every 210,000 blocks, which roughly equates to every 4 years, bitcoin’s supply issuance will be cut in half. This reduction in new bitcoin issued per block is known as “The Halving.” The first Halving event happened on November 28, 2012 as the number of new bitcoin released per block was reduced from 50 to 25. The second Halving occurred in July 2016, reducing the block reward to 12.5 and the third Halving event occurred in May 2020 which further reduced the supply issuance to 6.25 bitcoin per block.
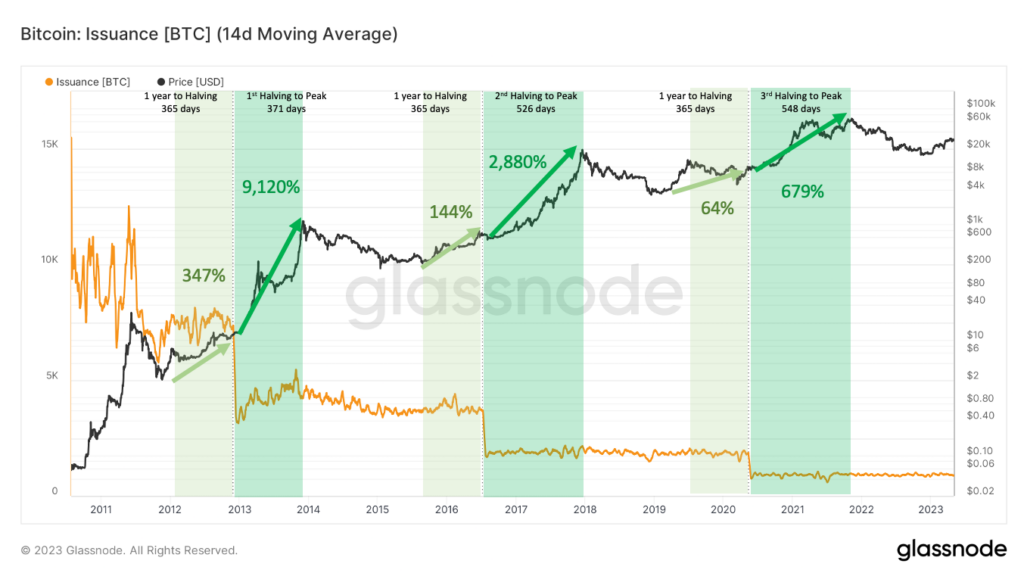
As a result of the Halving, the supply of available Bitcoin decreases every four years which naturally puts upward pressure on the price of bitcoin. Imagine if half of all global oil production went offline overnight, the price of oil would surely rise. Same phenomenon with bitcoin. Historically, this supply shock has led to enormous appreciation in bitcoin’s price following the Halving events. Interestingly, the 365 days leading up to the Halving has also been a very profitable time to own bitcoin as the crypto markets have historically bottomed out by then and excitement leading up to the Halving starts gaining momentum. We only bring this up because as of publishing this article, bitcoin’s next Halving event is one year away.
A decrease in supply puts upward pressure on price. Rising prices catch the attention of media, friends, investors, and more which increases the demand for bitcoin, further driving up its price. New entrants not only invest in bitcoin but begin looking to other cryptoassets starting with ETH and then eventually to more long tail assets. As a result, the market gets overheated, often characterized by rapid price appreciation of long tail assets which historically has coincided with the top of the cycle. As prices get too far out in front of fundamental metrics, the bubble inevitably bursts, and we get a sharp pull back like we saw in 2022. However, each cycle breeds new believers in bitcoin (aka HODLers) which creates a higher floor than the previous cycle. Through this boom and bust, we naturally have an upward trend in price over the long term. The Halving that occurs every four years is a big driver of why the crypto industry has historically moved in four-year cycles.
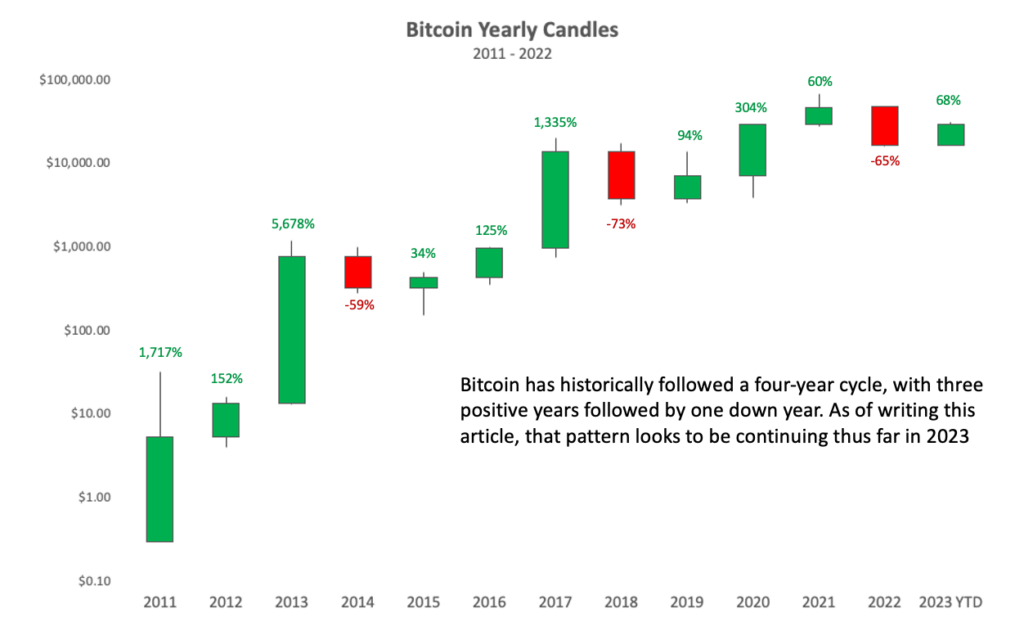
Bitcoin’s next Halving event is on schedule to take place in May 2024. From a historical point of view, that would indicate that we are just at the start of bitcoin’s growth portion of its four-year cycle. In January we published a research piece highlighting why we believed the on-chain data suggested bitcoin’s price had bottomed in November 2022 at $15,800. The price of bitcoin at the time we published that article was around $17,000. Since then, bitcoin’s price has climbed 68% to $28k as of writing this article and has outperformed most other cryptoassets just like early stages of past cycles. Thus far, this cycle seems to be right on track to follow the same pattern of each of the previous cycles.
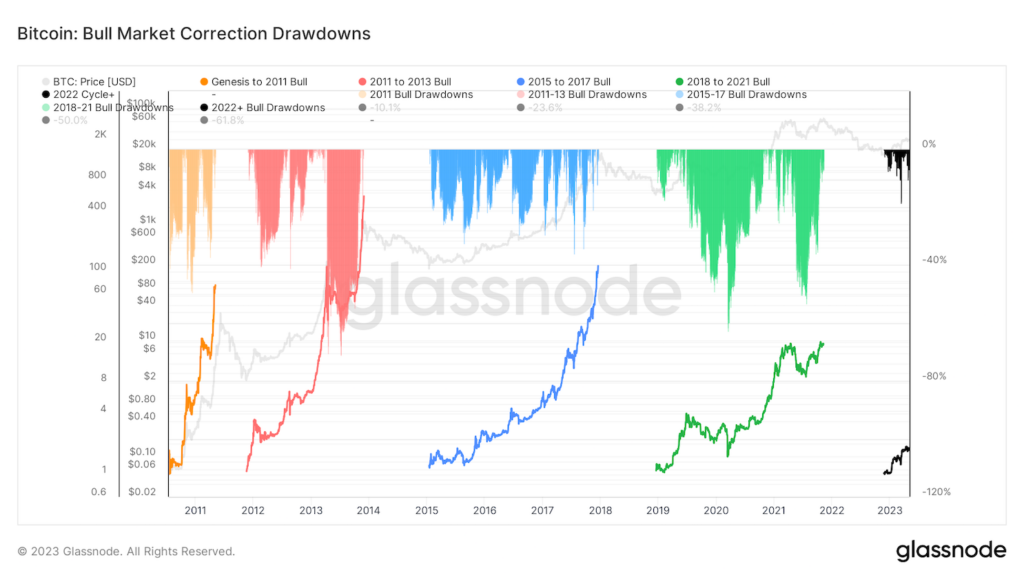
Assuming that the November low is indeed the bottom of this cycle as we predicted in January, what might we expect during this next phase? For one, while the price of bitcoin is likely to increase significantly over the next 2-3 years, it will not be a smooth road. Each previous bull cycle included multiple corrections of 30% or more before it reached its top. The last bull cycle, in which bitcoin ultimately went from $4,000 at the start of 2019 to $67,000 at its peak in November 2021, also saw the price drawdown at least 50% not just once, but twice. This is why, at Blockforce, we believe the most prudent approach to investing in crypto is to take a long-term orientation coupled with the ability to include short term hedging against volatility. This is the basis for our Multi-Strategy Fund.
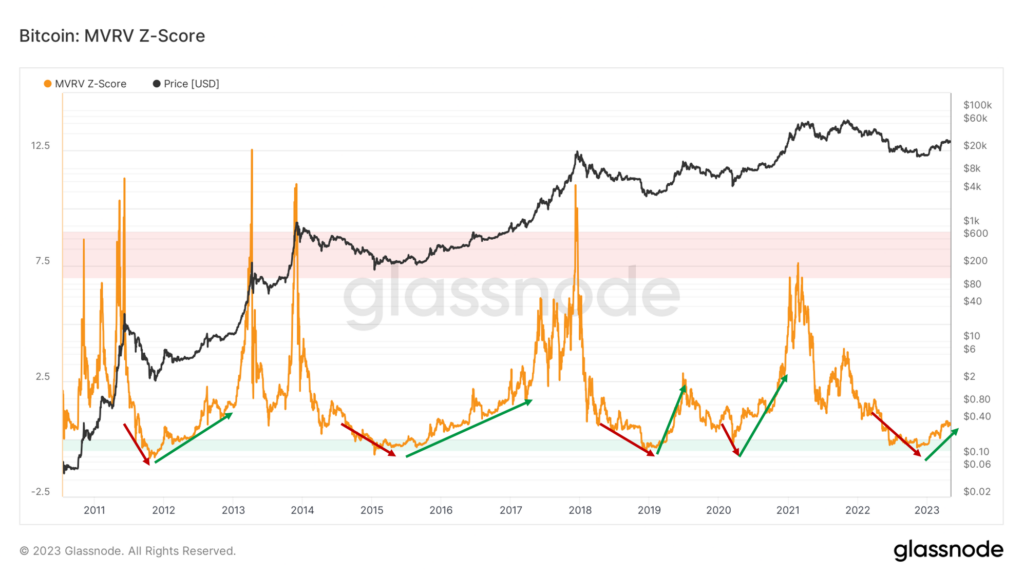
If we really are at the beginning of a longer bull cycle, the fundamental metrics should reflect that as well. Let’s start with one of the metrics I have covered a lot in past research articles, MVRV. First introduced by Nic Carter and Antoine Le Calvez of Coinmetrics in 2018, MVRV is a ratio comparing the market cap of bitcoin to the total value of the network based on the price at which each individual coin (or fraction of a coin) was last moved.
MVRV has historically been a great on-chain indicator of market tops and bottoms because a high ratio indicates that the price has appreciated to a point where holders are sitting on a lot of unrealized gains and may look to sell soon. As the ratio shrinks, and bitcoin trades closer to the price at which most holders last traded, this historically has represented a strong level of price support from investors who remain unfazed by short-term uncertainty. The bottom of MVRV has correlated with each of the previous cycles’ local bottom. Today, MVRV has bottomed out and is beginning to climb indicating we are likely at the beginning stages of the next bull cycle.
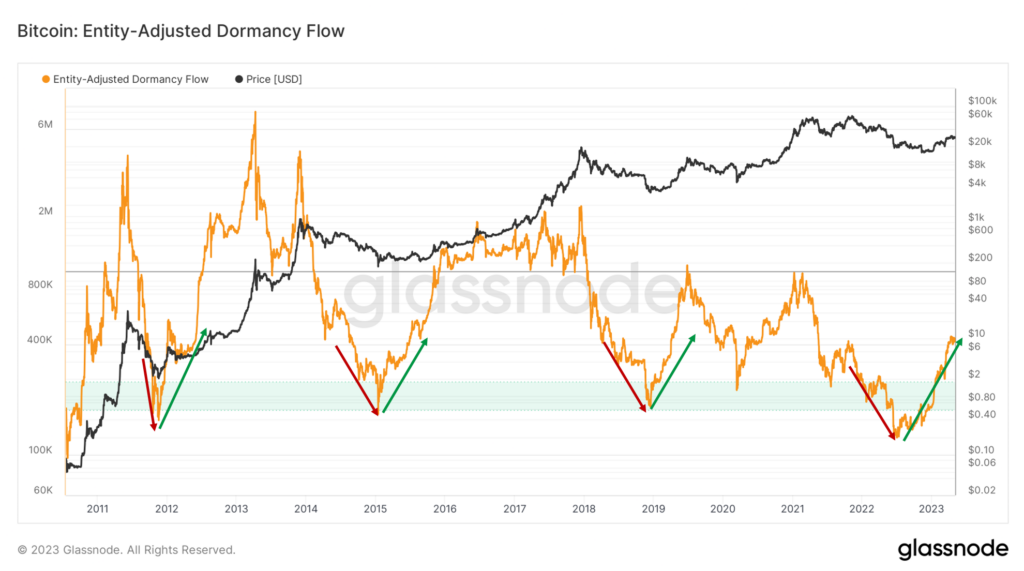
Another metric that indicates we are in the early stages of a bull market is Dormancy Flow. Originally created by David Puell, Dormancy Flow is a ratio between the market cap of bitcoin and the annualized dollar value of all coins transacted in a given year. When Dormancy Flow values are low, that is an indication that the market cap of bitcoin is undervalued compared to spending behavior and thus represents an attractive buying opportunity for investors. Dormancy Flow bottoms have historically correlated with market bottoms and while they are infrequent, they have provided a reliable indication of when BTC is a value buy.
In July, Dormancy Flow reached the lowest levels in bitcoin’s history. Since then, Dormancy Flow has steadily been rising which has historically indicated the early stages of the bull phase of the crypto market cycle.
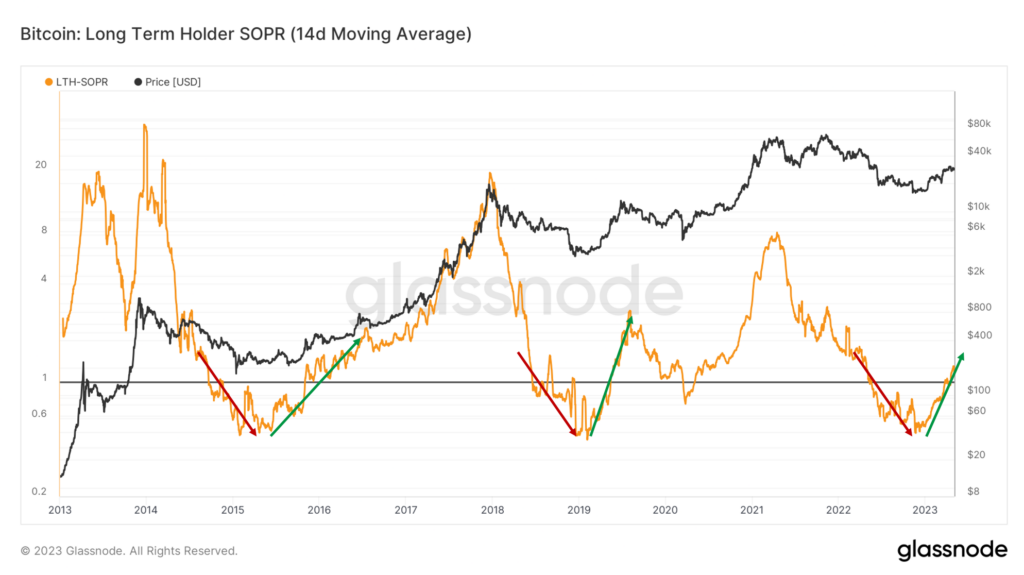
First introduced by Renato Shirakashi in 2019, SOPR compares bitcoin’s price at the time the user first received a bitcoin to the price at which that same bitcoin was “spent” (transferred to another wallet or sold on an exchange). The SOPR ratio simply reveals if that bitcoin was spent at a profit or a loss. We can then aggregate this ratio across all transactions that occurred over a period to understand the magnitude of the profit or loss the market is selling at. A SOPR above 1 indicates that the average price at the time of sale is greater than the average price at the time acquisition across all market participants. In other words, the market in aggregate is realizing profits. A SOPR below 1 indicates that the market in aggregate is taking losses on any bitcoin spent. Because SOPR captures the aggregate profit and loss realized by the market, this metric is often considered to be a reflection of market sentiment.
SOPR on its own is useful but the truth is, long term holders act very differently than short term speculators and SOPR really highlights this difference in behavior. SOPR for short term speculators tends to oscillate around 1 because the coins haven’t had much time to appreciate in value thus the magnitude of gains are likely to be much smaller. As a result, short term SOPR tends not to be as useful for identifying longer term trends. Long term holder SOPR however, is excellent for this purpose as this cohort tends to better reflect macro market shifts. After an extended period of realized losses (when LTH SOPR is less than 1), the long-term cohort has finally transitioned back to profitable spending, a structure similar to past cycle transition points.
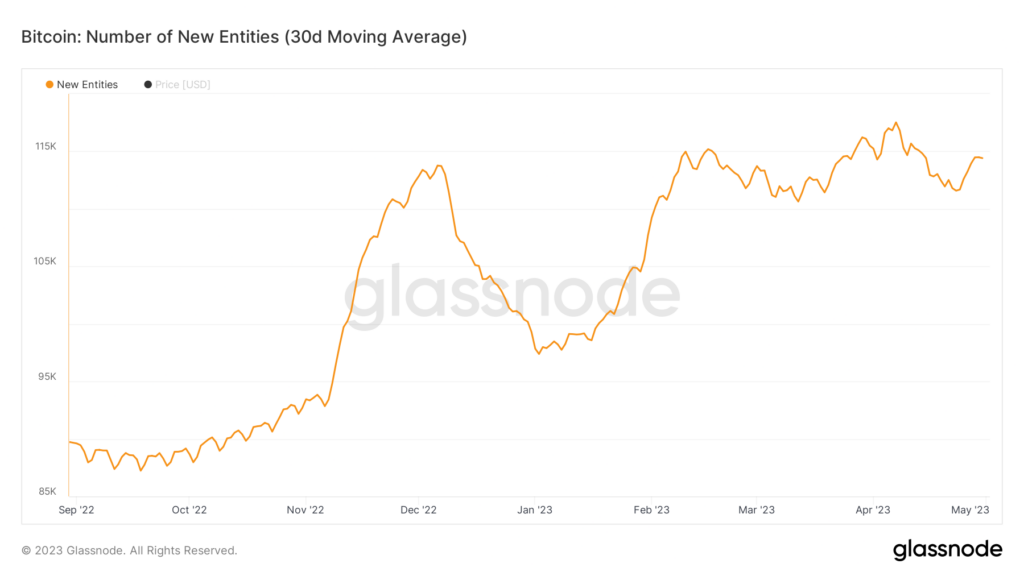
One last metric we wanted to cover and it doesn’t get more simple and basic than this. The number of new entities on the bitcoin blockchain is growing. The Bitcoin network is currently adding roughly 115,000 new entities per day over the past thirty days, up nearly 20% from the yearly moving average. Though a new entity doesn’t always equate to a new user (one user can have multiple entities) an increasing rate of new entities joining the network is a sign of increasing demand and has historically signaled a shift from bear to bull markets. Moreover, new addresses are being created at a near historic pace, only being eclipsed by the top of the 2017 and 2021 bull markets.
In January, the on-chain metrics indicated that the market had bottomed in November. Five months later, the on-chain metrics now seem to indicate we are transitioning into the early stages of the next bull cycle phase of the crypto market cycle. Thus far this year bitcoin has led the rally as has been the case during the early stages of every previous bull market cycle. Altcoin Season has not kicked off yet, as that will likely happen after bitcoin’s Halving which has historically been the catalyst that kicks the bull market into full swing. The current cycle is playing out eerily similar to the previous three and should it continue, we would likely see bitcoin (and the crypto markets at large) experience enormous value appreciation over the next 2-3 years with short periods of significant drawdowns along the way.
All on-chain and pricing data is provided by Glassnode.
Disclaimer: This is not investment advice. The content is for informational purposes only, you should not construe any such information or other material as legal, tax, investment, financial, or other advice. Nothing contained constitutes a solicitation, recommendation, endorsement, or offer to buy or sell any securities or other financial instruments in this or in any other jurisdiction in which such solicitation or offer would be unlawful under the securities laws of such jurisdiction. All Content is information of a general nature and does not address the circumstances of any particular individual or entity. Opinions expressed are solely my own and do not express the views or opinions of Blockforce Capital or Onramp Invest.
Disclaimer: This is not investment advice. The content is for informational purposes only, you should not construe any such information or other material as legal, tax, investment, financial, or other advice. Nothing contained constitutes a solicitation, recommendation, endorsement, or offer to buy or sell any securities or other financial instruments in this or in any other jurisdiction in which such solicitation or offer would be unlawful under the securities laws of such jurisdiction. All Content is information of a general nature and does not address the circumstances of any particular individual or entity. Opinions expressed are solely my own and do not express the views or opinions of Blockforce Capital or Onramp Invest.
BACK TO INSIGHTS