
By Brett Munster
In July of 2022, we authored a piece arguing that buying bitcoin below $20,000 was the best risk adjusted opportunity in bitcoin’s history based on two insights. First, bitcoin’s price was at levels not seen since 2017, but the asset is far less risky today due to continued adoption of the technology and token. Second, although we did not know at the time if bitcoin’s price had bottomed out, we theorized that price was unlikely to fall much further based on the historical on-chain metrics but had enormous upside over the long term. Hence, we argued that the potential reward for investing in bitcoin at any price below $20,000 far outweighed the risks. In other words, there was an asymmetric return opportunity. Since that piece, the industry has experienced multiple multi-billion-dollar collapses, numerous bankruptcies, and outright fraud (FTX and Three Arrows Capital). The result has been wide-scale, massive deleveraging in the system and significant credit contraction. And yet, bitcoin’s price remained at or above $16,000. Bitcoin withstood some of the most catastrophic events in crypto’s history and as of publishing this, is only down 14% since we authored that last article.
Given the events that unfolded over the past six months, we thought we would revisit the on-chain metrics as we start the new year to determine whether anything has changed that would make us reconsider our July assessment. The following is an analysis of a variety of on-chain metrics that Blockforce Capital routinely monitors to provide a granular view into different parts of the crypto markets. These metrics typically provide insights into the behavior of various cohorts of bitcoin users, investors, and miners. However, it’s rare that nearly every on-chain metric aligns so unanimously as is the case today. For that reason, we will attempt to make the case, based on historical data, as to why it’s very likely that bitcoin has bottomed out and reaffirm that this current period is one of the best investment opportunities in the history of the crypto markets.
MVRV z-score
Let’s start with one of the most used and reliable market cycle metrics, MVRV.
First introduced by Nic Carter and Antoine Le Calvez of Coinmetrics in 2018, MVRV is a ratio comparing Market Value (MV) to Realized Value (RV). Market Value is simply another name for market cap while Realized Value calculates the value of the network using the price at which each individual coin (or fraction of a coin) was last moved. Realized Value is thus a gross approximation of the network’s aggregate cost basis.
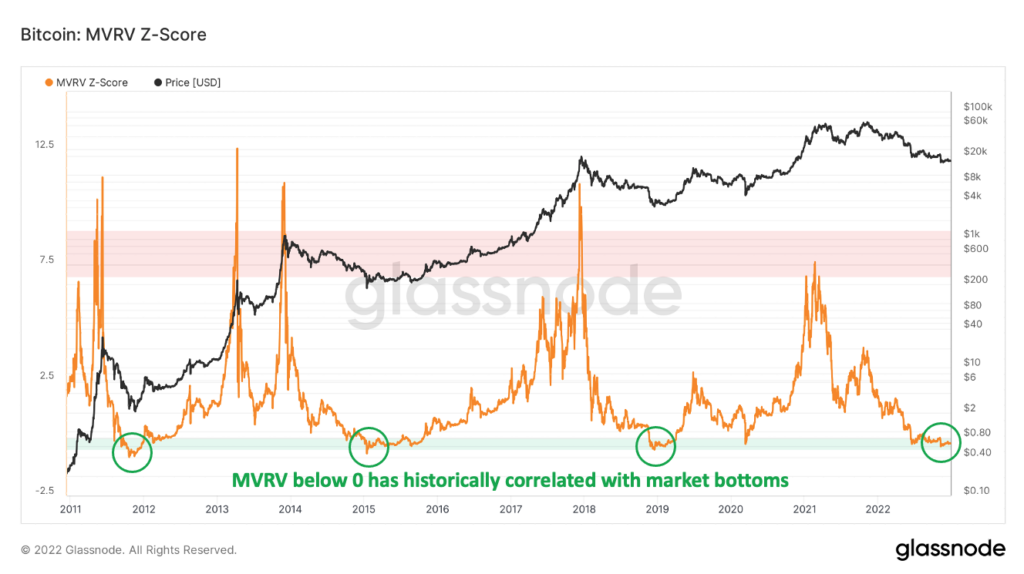
MVRV has historically been a great on-chain indicator of market tops and bottoms because a high ratio indicates that the price has appreciated to a point where holders are sitting on a lot of unrealized gains and may look to sell soon. As the ratio shrinks, and bitcoin trades closer to the price at which most holders last traded, this historically has represented a strong level of price support from investors who remain unfazed by short-term uncertainty. By incorporating the standard deviations of how much the market value differs from the realized value in the ratio (z-score) we can further clarify the signal from the noise.
Prior to 2022, bitcoin’s MVRV z-score has fallen below 0 only three times in the past decade; October 2011, January 2015, and December 2018. Each of those periods proved to be the very bottom of that cycle. The fourth time bitcoin’s MVRV z-score fell below 0 was this past November. On only 7.1% of all days in bitcoin’s history has bitcoin traded at a lower MVRV ratio than it is currently trading, meaning its statistically very likely that bitcoin’s price will rise over the course of 2023.
On Chain Cost Basis
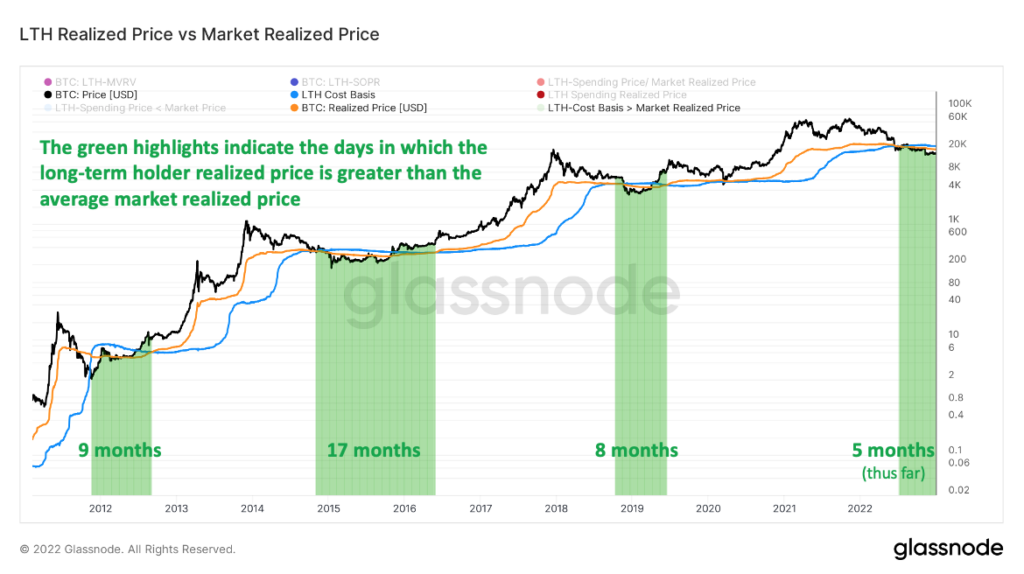
We can take the concept of Realized Price from the previous metric a step further by separating the Realized Price between short-term market participants and long-term holders of bitcoin. These two cohorts tend to act very differently so it’s often helpful to segment out each cohort when analyzing market dynamics. Short term holders, because they buy and sell more often and over much shorter time frames, typically have an average cost basis (aka short term Realized Price) that closely follows the price of bitcoin. It also tends to flip back and forth quite often from being higher than bitcoin’s price and then lower and then higher again. Frankly, this isn’t all that interesting.
Long term holders on the other hand, typically have a Realized Price that is much lower than the current price of bitcoin because they bought long ago at lower prices. Only during severe drawdowns does the current price of bitcoin fall below long-term holders’ Realized Price. Even more rare, is when the overall market’s realized price falls below the aggregate long-term holder realized price. This situation tends to correlate with market bottoms, and has historically lasted between 8 – 17 months in past bear market drawdowns. We are currently 5 months into the market Realized Price being lower than long term holder Realized Price which would indicate that while we may have reached a bottom, we are likely to stay around these price levels for a few more months at the very least. As of publishing this, current long term holder cost basis is $22,600 while the market’s cost basis is $19,800. This will be one metric we watch closely, because when it flips back that will be a strong signal that the next bull market is just beginning.
Dormancy Flow
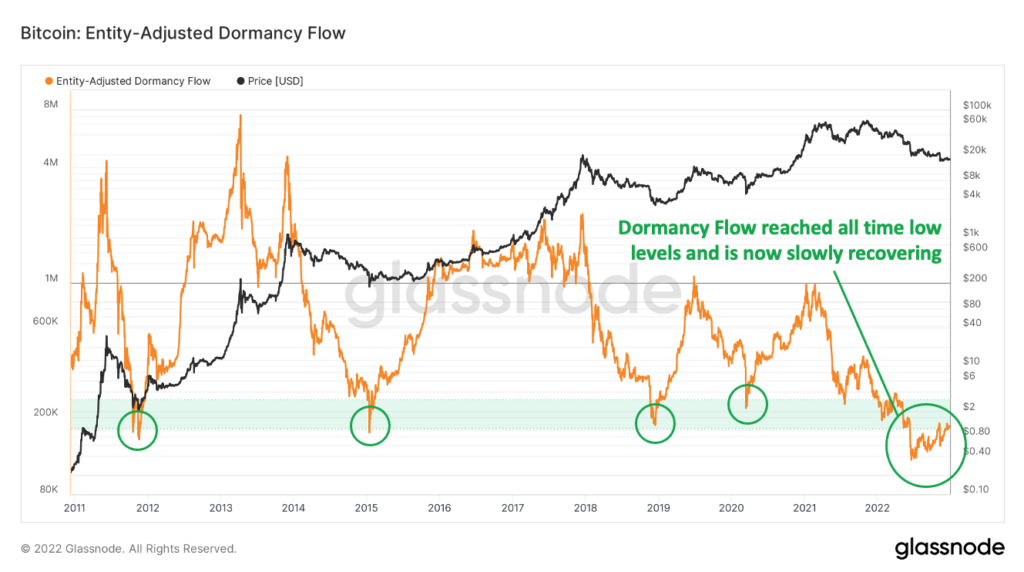
Another metric that indicates we have hit the bottom is Dormancy Flow. Originally created by David Puell, Dormancy Flow is a ratio between the market cap of bitcoin and the annualized dollar value of all coins transacted in a given year. Thus, Dormancy Flow is a good way of tracking spending behavior on the network relative the value of the network. When Dormancy Flow values are low, that is an indication that the market cap of bitcoin is undervalued compared to spending behavior and thus represents an attractive buying opportunity for investors. Dormancy Flow bottoms have historically correlated with market bottoms and while they are infrequent, they have provided a reliable indication of when BTC is a value buy.
In July, Dormancy Flow reached the lowest levels in bitcoin’s history. Since then, Dormancy Flow has slowly been rising, though still at historically low levels, indicating that the worst may be behind us, but price still sits at extremely attractive levels based on historical trends.
Reserve Risk
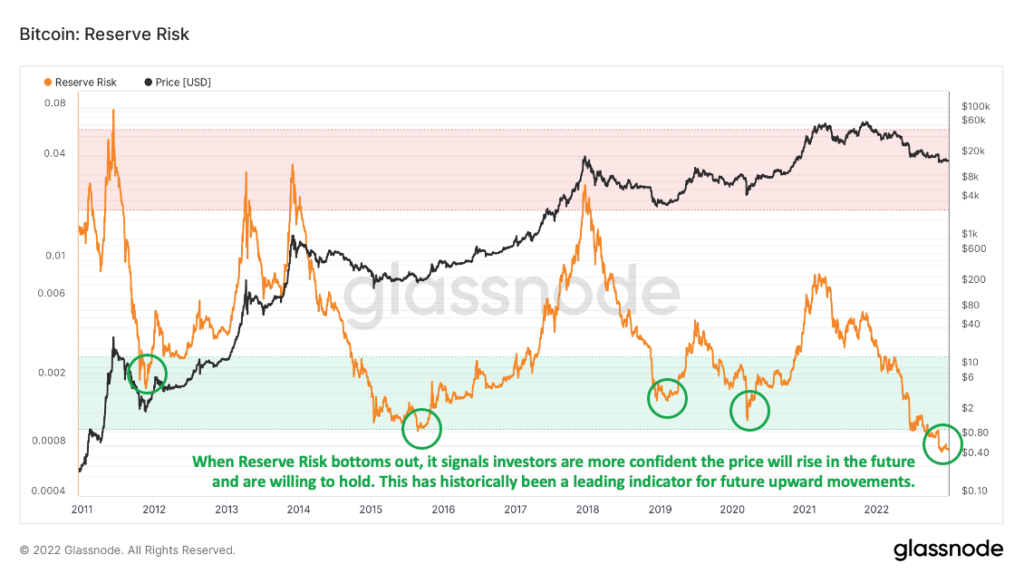
Another way to determine market bottoms is to evaluate the confidence the market has in the future economic value of bitcoin. This is what Reserve Risk attempts to measure. This metric divides the price of bitcoin by the cumulative opportunity cost of holding bitcoin over the lifetime of the bitcoin network. The result is a measurement that can be used as a proxy for the confidence investors have in the future price of bitcoin relative to the price today. When confidence is low and price is high (hence a high Reserve Risk), then bitcoin’s value is likely to decrease. When confidence is high and price is low (ie: Reserve Risk is low), there is high likelihood that the price will increase in the future.
Reserve Risk is currently at all-time lows but appears to have stabilized following the collapse of FTX. In other words, the data suggests that most users expect the price to rise in the future and are choosing to hold their coins. Historically speaking, that tends to be a leading indicator that the market is beginning to turn back upwards.
Bitcoin Age Distribution
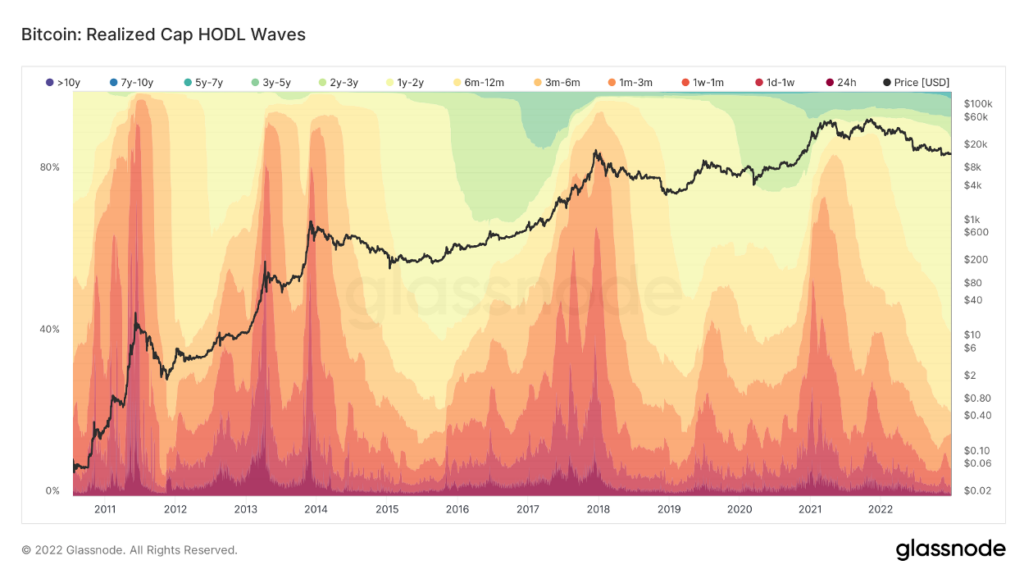
We can learn a lot about market cycles by understanding the age of coins that are being transacted at any given period. First pioneered by Unchained Capital in 2018, this visual representation of coins grouped by the age since they last moved is called HODL Waves. The bottom, warmer colors (reds, oranges) represent bitcoin that have transacted very recently while the top, cooler colors (greens, blues and purple) represent bitcoin that haven’t moved in a long time.
What we can observe is that during peak mania, we historically have seen long-term holders start to sell as prices rise to new highs. Older coins, which have not moved in a long period of time, now become part of the liquid supply and become reclassified as part of the younger cohort of coins. Thus, the percent of younger coins begins to spike which has historically signaled a rush into the space and the market becoming overheated (large red and orange spikes in the graph below). Conversely, when the percent of younger coins decreases and coins in aggregate begin to mature into older cohorts, it’s a signal that a greater portion of the market is becoming more long term oriented thus restricting the amount of available supply to be traded. This supply squeeze has historically coincided with higher prices in the future. Today, the number of younger coins is at all-time lows as a greater percentage of the market is currently not willing to sell the bitcoin it is holding. This behavior leads to strong support levels and builds a base from which bitcoin’s price can grow.
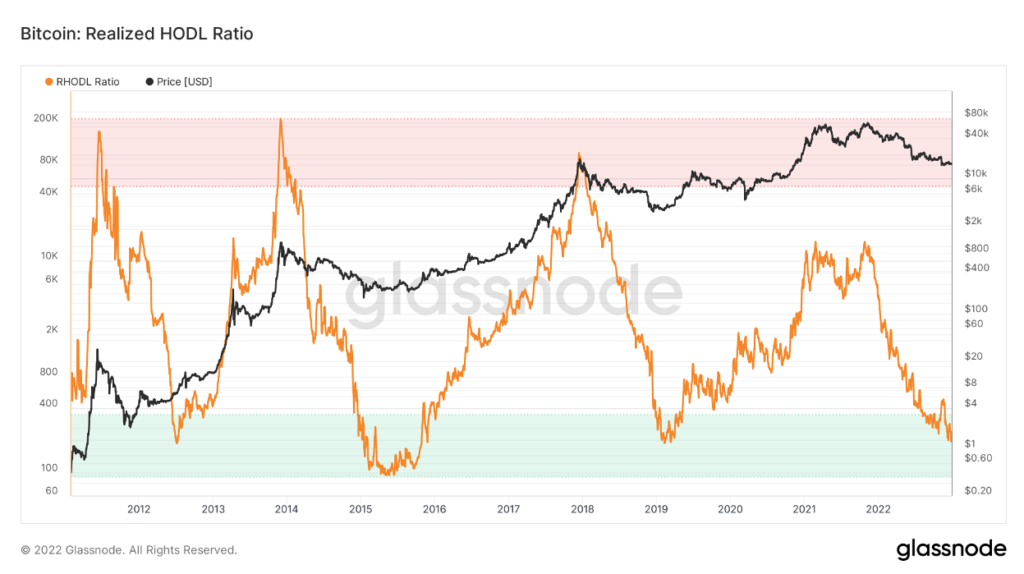
We can take this analysis a step further by isolating specific age bands. Of all the different bands, the “1-year to 2-year” cohort and the “1-week to 1-month” cohort are particularly interesting because historically, these two bands tend to move inversely of each other. At market bottoms, the “1-year to 2-year” ratio tends to be at maximum supply for that cycle while the supply of coins “1-week to 1-month” old are at a minimum. The reverse has also historically been true at market tops. Understanding this phenomenon and layering in the realized value of the coins for each cohort, we come up with a metric known as the Realized HODL Ratio (RHODL).
First created by Philip Swift in 2020, the RHODL is the ratio between the realized value of the “1-week to 1-month” cohort compared to the realized value of the “1-year to 2-year”. Because older coins tend only to sell when there is a large run up in price, this metric gives us a clear view into the cyclical nature of long-term holders selling to short term market participants. As a result, RHODL tends to closely track with the macro market cycles. A high RHODL ratio (red band in the chart below) is an indication of an overheated market with lots of previously locked up supply coming onto the market and has historically corresponded with cycle tops. A low RHODL ratio (green band in the chart below) indicates the market is entering an accumulation phase and has historically coincided with cycle bottoms.
Miners
Miners are the lifeblood of the bitcoin network, validating transactions and securing the network. Thus, it makes sense to monitor miner activity to gauge market cycles. Every time a miner successfully “mines” a block, they are rewarded with a combination of newly issued bitcoin (otherwise known as a block subsidy) and a transaction fee. Together, block subsidies and transaction fees make up miners’ revenue. Aggregating the cumulative miner revenue is referred to as the “thermocap” of a network.
Miners also have costs associated with their business, namely the mining rigs, electricity expense and rent. Therefore, thermocap can be thought of as the max amount a miner can spend to secure the network and remain in business. Because miners are responsible for security, thermocap can also be thought of an approximation of the amount spent by the network to keep it secure and functioning properly.
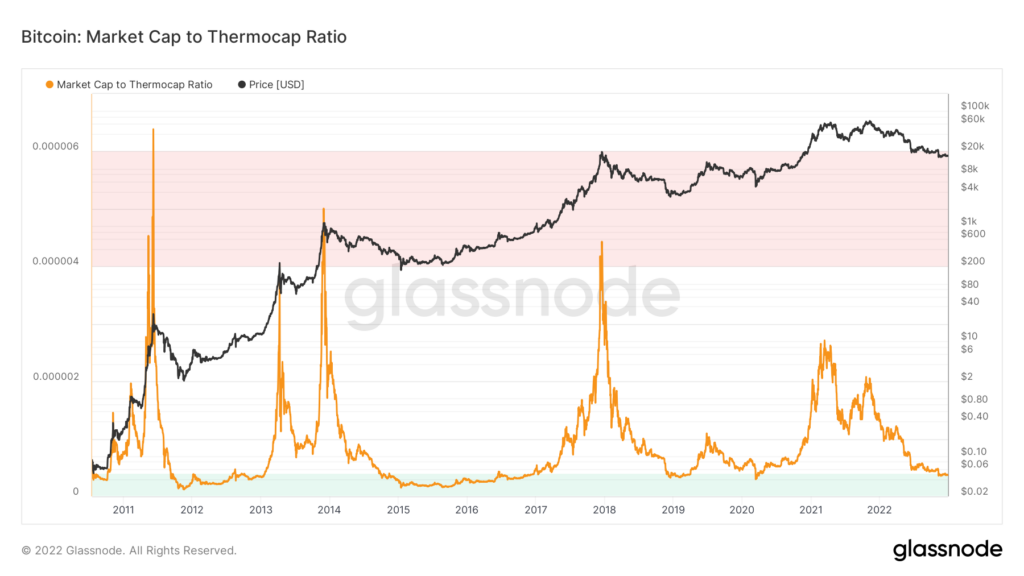
First introduced by Nic Carter of Coinmetrics, we can compare bitcoin’s market cap to its thermocap to get a relative sense for how much value the network is getting for this “spend” on security and infrastructure. Because bitcoin’s supply issuance is relatively constant, thermocap does not fluctuate nearly as much as market cap. A large ratio typically occurs when the market cap has risen sharply indicating that bitcoin may be overvalued. The reverse is true as well, as the ratio declines, it signals that bitcoin is undervalued by the market relative to the total security spend by miners. Historically, a low market cap to thermocap ratio has historically signaled a relatively good time to buy.
Miners are typically forced to sell some portion of their bitcoin block subsidies to help pay for ongoing operations. It’s also true that miners are likely very bullish on the long-term prospects of BTC based on the fact that they have invested millions of dollars in their mining operations. Given this long-term orientation, the fact that they must sell BTC to help fund operations and the short-term volatility of bitcoin, miners naturally assess their current income streams relative to long term averages to make decisions on when and how much BTC to sell. Miner profitability can therefore be considered a useful metric to track when attempting to understand supply-side sell pressure.
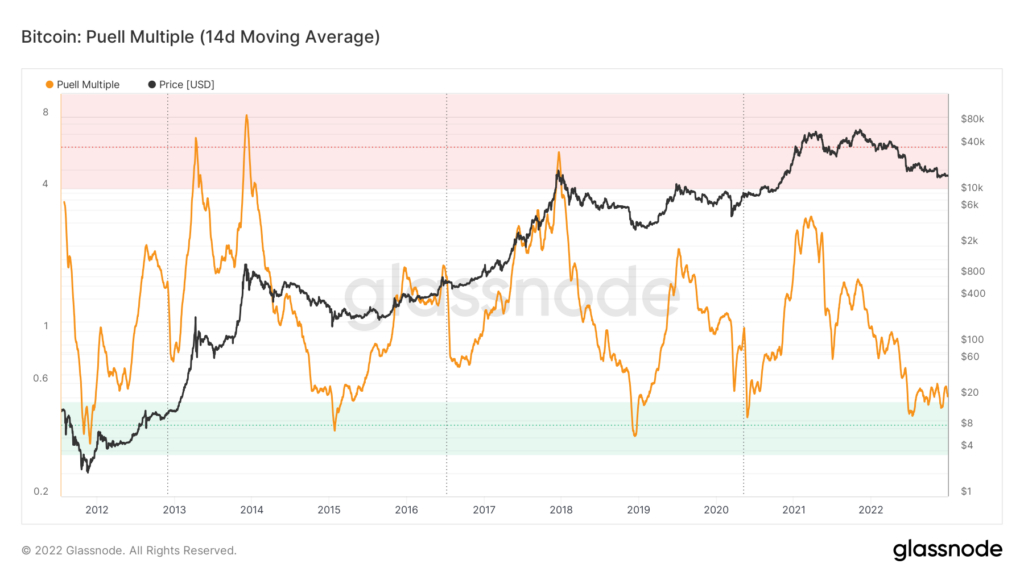
The Puell Multiple was first introduced in April 2019 by David Puell and is designed to monitor this phenomenon. The Puell Multiple tracks current miner revenue (in USD) and compares it to the annual average income. Thus, this metric provides indication of aggregate miner profitability relative to the yearly baseline. A high Puell Multiple indicates that mining operations are more profitable at that moment in time than other periods of the year. Conversely, a low multiple indicates that mining is relatively less profitable than it has been in the past. This decreasing profitability puts stress on the miners who can’t operate at lower prices which eventually leads to some miners being forced to shut down. When weaker miners leave the network, miners in stronger financial positions gain in market share. These remaining miners will have a larger share of the income, mined for the same fixed costs, and therefore can liquidate fewer coins and begin building reserves. The result is that the overall liquid supply of BTC decreases, putting upward pressure on price.
Due to these market incentives, the Puell Multiple can be a valuable indicator for identifying tops and bottoms of market cycles. Whenever the Puell Multiple has dropped below 1, that indicates there is stress on the mining business model and its likely we could see some miners close shop. As we just explained, this has a cascading effect that eventually leads to upward pressure on price over time. Historically, every instance of the Puell Multiple dipping into this zone has served as an excellent time to buy bitcoin.
Length of Past Bear Market Cycles
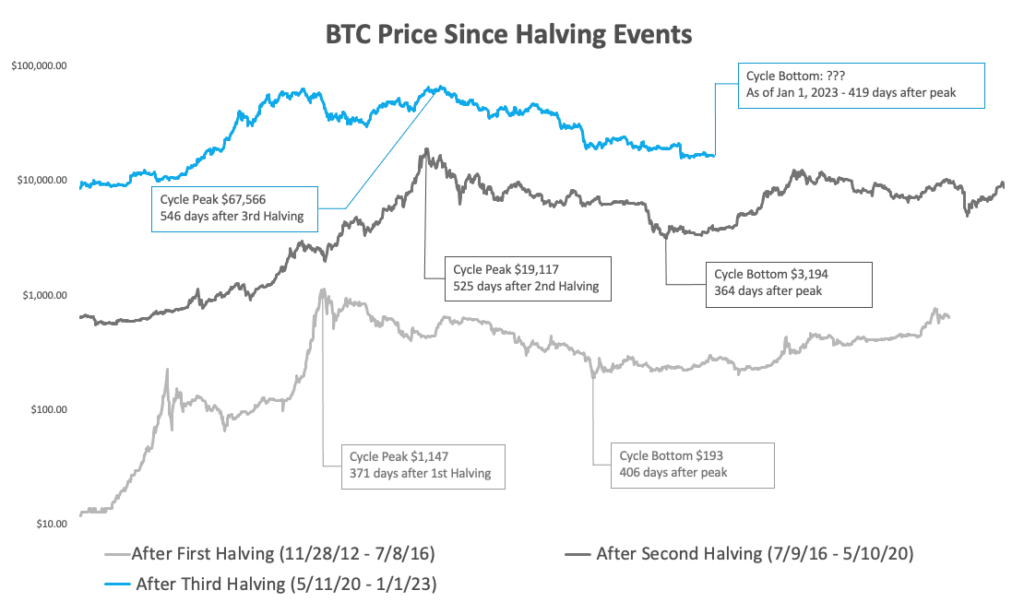
Bitcoin’s supply issuance per block gets reduced by half every 210,000 blocks which roughly equates to every four years. Thus, bitcoin boom and bust cycles have historically operated on a four-year cadence. When we plot all the cycles alongside each other, it immediately becomes apparent that they exhibit very similar characteristics. Thus, we can look to these past cycles to get a sense for where we are in the current one.
We can see that all prior bitcoin cycles had bottomed by this point. This is yet another indication that based on historical precedence, now may be an optimal time to allocate to bitcoin.
Conclusion
While it’s impossible to know with 100% certainty as of now whether bitcoin has already reached the bottom of this cycle, the on-chain data suggests it’s highly likely. In many ways, many on-chain metrics, market structure, and investor behavior patterns are textbook bear market floor. With such a chaotic year, the resolve of Bitcoin holders has been firmly tested to a historic degree throughout 2022 and yet, the percentage of bitcoin that have not moved in over a year is at all-time highs. There are no more large forced sellers left caused by the massive unwind and deleveraging that we saw starting with the collapse of LUNA back in May.
Despite current fear, uncertainty and doubt in the market, bitcoin’s upside remains unchanged. As we wrote in our look back on 2022, adoption has only accelerated throughout the year. The Lightning Network continues to grow and has the potential to enable billions of people to transfer money across the globe instantaneously, securely, and for nearly free. The launch of the Taro Network allows assets other than bitcoin to be transacted on the base layer blockchain increasing the number of financial services that the bitcoin blockchain can support. Even if bitcoin only becomes a store of value and reaches parity with gold, that will result in a price of roughly $500,000 per bitcoin (28x from current prices). And that’s ignoring the possibility of stealing market share from other store of value assets (such as real estate, bonds, collectibles, and more) or becoming a medium of exchange (in which case the market size is likely in the tens of trillions of dollars).
It’s a matter of when bitcoin will once again reach new all-time highs, not if. The biggest unknown at this point is the duration of this current down market, of which history would suggest there may be several months still ahead before a full recovery. Our best guess is that we likely won’t see a v-shaped recovery, but rather, we could experience sideways action for some time before moving back up. However, when this does turn, bitcoin’s price is likely to rise faster and higher than most people expect.
On-chain data is provided by Glassnode.
Disclaimer: This is not investment advice. The content is for informational purposes only, you should not construe any such information or other material as legal, tax, investment, financial, or other advice. Nothing contained constitutes a solicitation, recommendation, endorsement, or offer to buy or sell any securities or other financial instruments in this or in in any other jurisdiction in which such solicitation or offer would be unlawful under the securities laws of such jurisdiction. All Content is information of a general nature and does not address the circumstances of any particular individual or entity. Opinions expressed are solely my own and do not express the views or opinions of Blockforce Capital or Onramp Invest.
Disclaimer: This is not investment advice. The content is for informational purposes only, you should not construe any such information or other material as legal, tax, investment, financial, or other advice. Nothing contained constitutes a solicitation, recommendation, endorsement, or offer to buy or sell any securities or other financial instruments in this or in any other jurisdiction in which such solicitation or offer would be unlawful under the securities laws of such jurisdiction. All Content is information of a general nature and does not address the circumstances of any particular individual or entity. Opinions expressed are solely my own and do not express the views or opinions of Blockforce Capital or Onramp Invest.
BACK TO INSIGHTS