
By Brett Munster
Approaching the bottom
Bitcoin has once again declined roughly 50 percent from its all-time high. With that drawdown has come the familiar mix of anxiety, second-guessing, and exhaustion that characterizes every crypto bear market. For newer participants, the experience feels chaotic and destabilizing. For those who have lived through multiple cycles, it feels cyclical and structurally familiar.
Having invested through three prior cycles, one lesson stands out: tops tend to form quickly; bottoms form slowly. Bull markets often accelerate into peaks where momentum becomes self-reinforcing. Leverage expands rapidly, narratives converge into a single consensus, and price action begins to feel inevitable. When that dynamic reverses, the unwind is typically abrupt and violent.
Bear markets, by contrast, are processes rather than events. Instead of a sharp climax, they grind. Prices drift lower, rallies fail, sentiment erodes, and conviction is slowly worn down. Historically, bitcoin bottoms are not single moments but extended periods of accumulation that unfold over months.
Because of this asymmetry, timing an exact top is nearly impossible. Identifying a probabilistic bottoming range, however, is far more achievable. Investors who understand this dynamic can approach bear markets not with panic, but with a systematic framework for accumulation. Recognizing that structural difference between how markets top and how they bottom is the starting point for navigating the current cycle rationally rather than emotionally.
The prior cycle illustrates this dynamic clearly. In November 2021, bitcoin peaked near $69,000. By July 2022, it had fallen to roughly $19,000. At the time, we argued that accumulating below $20,000 represented one of the most attractive risk-adjusted entry zones in the asset’s history, even though the exact bottom was unknowable and had not yet formed. The ultimate low printed around $15,600 in December 2022. Investors who accumulated under $20,000 had approximately seven months to build exposure at deeply discounted levels. Missing the final 5–6 percent of downside proved irrelevant for long-term positioning; what mattered was recognizing that forced selling was largely exhausted and that value had emerged on a probabilistic basis.
Today, bitcoin has declined from its recent all-time high of $126,000 to as low as $60,000—again, roughly a 52 percent retracement. We are clearly in a cyclical bear phase. The question is not whether we are in a drawdown, but where a durable bottom is likely to form and how capital should be positioned through it.
Our framework for identifying potential bottoming zones rests on four historically reliable indicators. The first is Realized Price, which approximates the average on-chain cost basis of the entire circulating supply. When the spot price trades near or below Realized Price, long-term holders as a group approach breakeven, and capitulation pressure often begins to exhaust itself. That metric currently sits near $54,000.
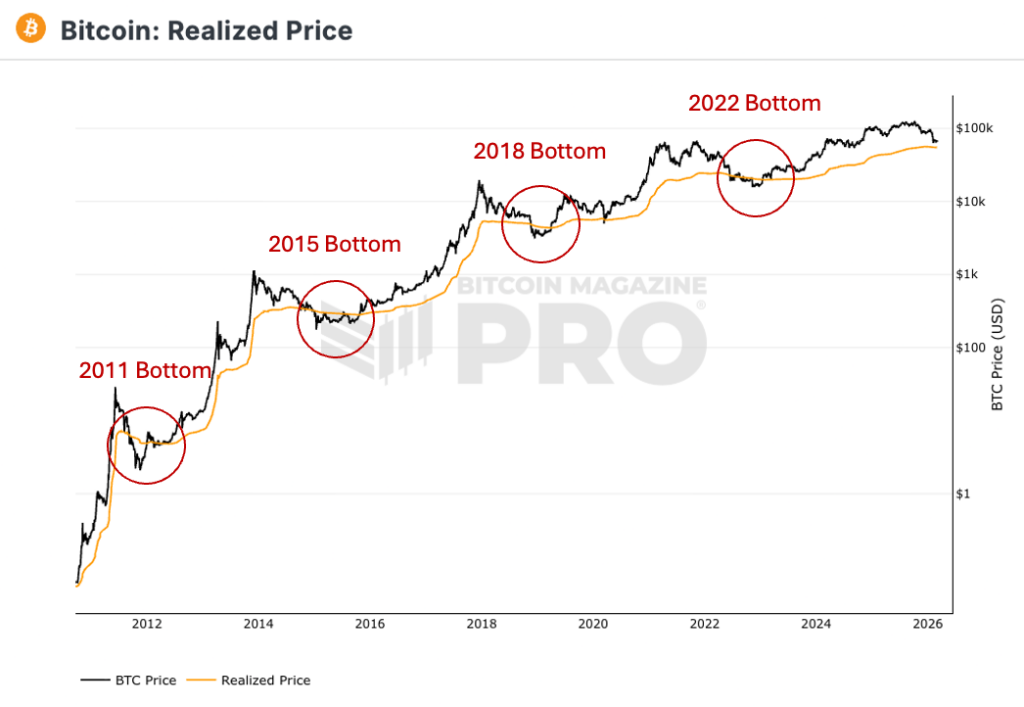
Source: BitcoinMagazinePro
The second is the 200-week moving average, a long-observed technical level that has marked prior secular lows. It presently resides near $58,000. In past cycles, bear market troughs have coincided with touching, or briefly undercutting, this long-term trendline, reinforcing its relevance as a structural support level.
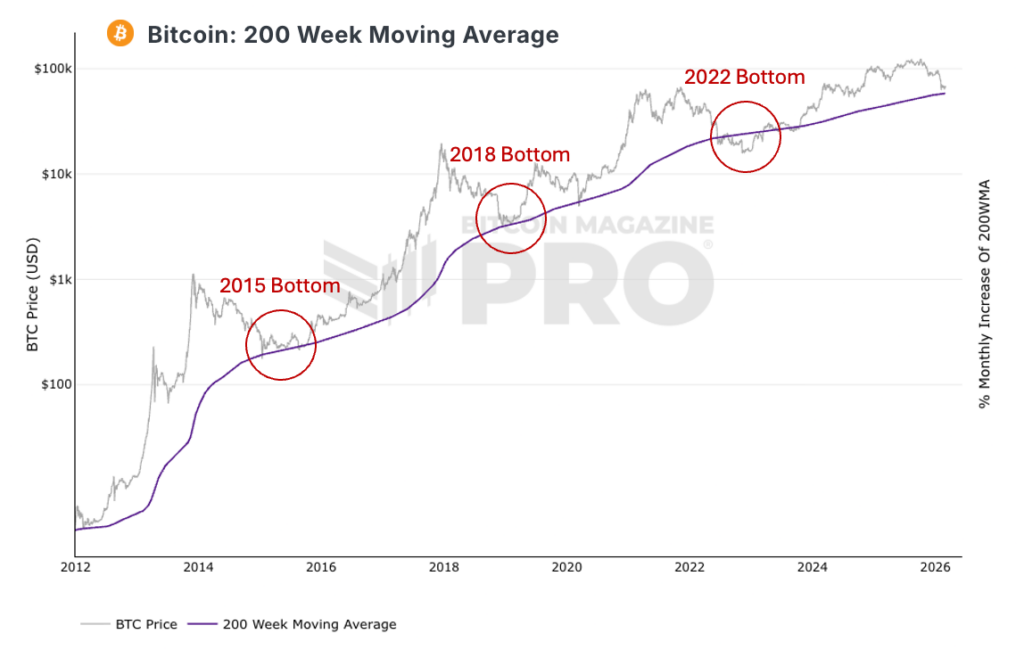
Source: BitcoinMagazinePro
Third is the MVRV Z-Score, which estimates whether bitcoin is relatively expensive or inexpensive compared to the aggregate price investors originally paid. Historically, when the score falls below 0.40, the asset has traded at depressed or undervalued levels. Today it stands at approximately 0.38. Since 2017, the metric has been this low only about 15 percent of the time, underscoring the rarity of such conditions. In prior bear markets, including 2018 and 2022, it remained at similarly depressed levels for weeks or months. In both instances, investors who accumulated during those periods ultimately realized substantial gains over the following two to three years, even though prices occasionally declined further before fully recovering.
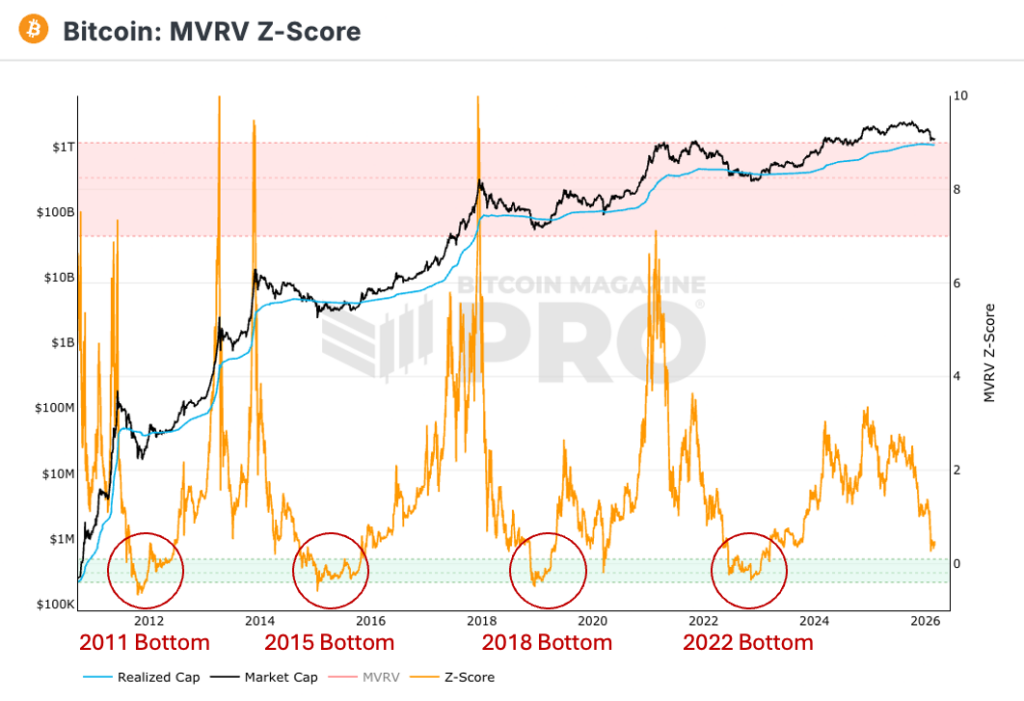
Source: BitcoinMagazinePro
The fourth consideration is the magnitude of peak-to-trough drawdowns. Each successive cycle has exhibited diminishing percentage declines as the asset class matures, liquidity deepens, and institutional participation increases. A structurally maturing market typically implies smaller cyclical retracements over time. Extrapolating that pattern suggests that a 55 to 65 percent decline this cycle would be consistent with the historical trend, implying a potential bottoming range between $45,000 and $55,000.
Taken together, the convergence of these four factors—Realized Price near $54,000, the 200-week moving average near $58,000, MVRV at levels historically associated with market troughs, and a drawdown magnitude consistent with prior cycles—creates a high-probability accumulation zone between approximately $45,000 and $60,000. Bitcoin has already traded to roughly $60,000, touching the upper boundary of that projected range, and has recently oscillated between $60,000 and $70,000.
Stabilization dynamics are also emerging in flow data. ETF outflows have not only moderated, but the start of March has already seen approximately $1.5 billion in net inflows over first few days, bringing year-to-date flows close to net positive territory and suggesting a tentative improvement in institutional demand. Sustained inflows would likely serve as a durable tailwind. Additionally, more than 400,000 BTC were accumulated in the $60,000 to $70,000 range during the recent downturn, indicating that long-term holders and new entrants are absorbing supply. In practical terms, the forced sellers appear increasingly exhausted.
None of this guarantees that the bottom is definitively in place. Macro conditions, geopolitical shocks, or regulatory developments could drive prices lower. It is entirely possible that the $60,000 print on February 6 marked the low. It is equally plausible that price grinds somewhat lower, perhaps dipping into the $50,000s and briefly undercutting long-term averages before stabilizing. However, in either scenario, the majority of the drawdown appears to be behind us, and the asymmetry is shifting.
Historical context reinforces this perspective. In prior cycles, buying after a 50 percent retracement—even without perfectly timing the ultimate bottom—produced compelling forward returns over multi-year horizons. After the 2013 peak near $1,156, a 50 percent retracement to roughly $578 preceded a multi-year advance that ultimately carried prices over 100x higher. Following the 2017 high near $20,000, purchasing around $10,000 eventually delivered nearly seven fold return even at today’s depressed prices. After the 2021 high near $68,000, buying near $34,000 proved highly accretive over the subsequent cycle. In each case, the market eventually traded lower after the initial 50 percent drawdown before fully bottoming. Yet those interim purchases nonetheless represented exceptional long-term entries.
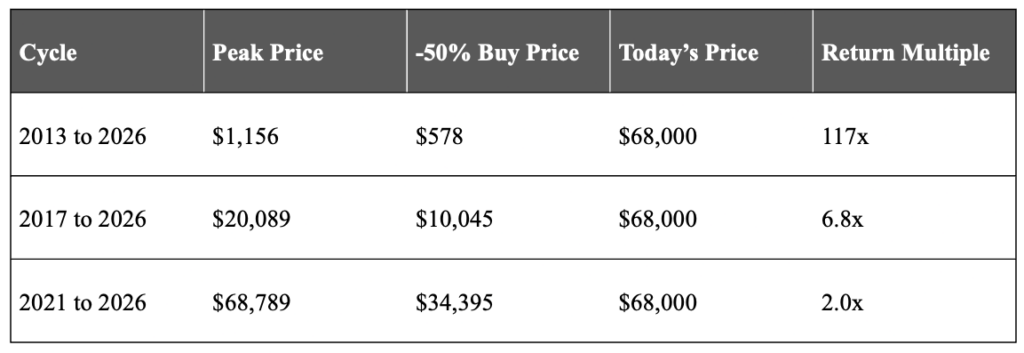
Source: CoinMarketCap
Drawdowns, however, are defined not only by depth but also by duration. The acute price pain—a 52 percent decline—has largely occurred. However, time pain likely remains. Across prior cycles, the average duration from peak to trough has been approximately nine to ten months. If the October high marked this cycle’s peak, historical precedent would suggest potential bottoming sometime mid-year. That does not imply a straight line lower; more often it implies a prolonged sideways grind that tests conviction. The major exception was the COVID-19 shock in March 2020, when a policy-induced liquidity collapse was followed by extraordinary fiscal and monetary stimulus. Today’s macro backdrop is more conventional, with no immediate policy catalyst likely to trigger an abrupt V-shaped recovery.
For investors, the implication is straightforward. There is limited edge in attempting to capture the final 3 to 5 percent of downside relative to long-term value creation. The difference between $19,000 and $15,600 in 2022 felt enormous in real time. In hindsight, it was negligible for investors with a multi-year horizon. Today, the 200-week moving average near $58,000 and Realized Price near $54,000 sit just below recent lows. Waiting for a marginal undercut may provide psychological precision but offers limited incremental benefit relative to the opportunity cost of remaining under allocated
A disciplined approach is to scale into the bottoming range rather than attempting to deploy capital at a single price. Accumulation should occur gradually over months, not days. Three years from now, purchases in the $60,000s are likely to appear attractive. Purchases in the $50,000s, if available, may appear even more so. What will ultimately matter is not whether one captured the exact bottom tick, but whether one maintained the conviction and process to accumulate when risk-reward was skewed favorably.
Bear markets are inherently uncomfortable. They function as mechanisms that transfer assets from the impatient to the patient. For long-term allocators, however, a 50 percent drawdown in a structurally maturing and increasingly institutionalized asset class is not a signal for reflexive retreat. It is a signal to analyze the data rigorously and position deliberately. The challenge now is patience and disciplined execution. The opportunity lies in maintaining both.
Disclaimer: This is not investment advice. The content is for informational purposes only, you should not construe any such information or other material as legal, tax, investment, financial, or other advice. Nothing contained constitutes a solicitation, recommendation, endorsement, or offer to buy or sell any securities or other financial instruments in this or in any other jurisdiction in which such solicitation or offer would be unlawful under the securities laws of such jurisdiction. All Content is information of a general nature and does not address the circumstances of any particular individual or entity. Opinions expressed are solely my own and do not express the views or opinions of Blockforce Capital.
Disclaimer: This is not investment advice. The content is for informational purposes only, you should not construe any such information or other material as legal, tax, investment, financial, or other advice. Nothing contained constitutes a solicitation, recommendation, endorsement, or offer to buy or sell any securities or other financial instruments in this or in any other jurisdiction in which such solicitation or offer would be unlawful under the securities laws of such jurisdiction. All Content is information of a general nature and does not address the circumstances of any particular individual or entity. Opinions expressed are solely my own and do not express the views or opinions of Blockforce Capital or Onramp Invest.
BACK TO INSIGHTS